




Product/Operations Update
Allcargo Global Reports September Volume Declines
Allcargo Global reported September 2026 LCL, FCL and air volumes declined year-on-year, while container utilization improved and freight rates remained elevated.



Welcome to Multibagg AI
Log in to access personalized features
IRIS
Multibagg AI is an AI powered stock research and analysis platform. We provide data, information, content, and analytics for publicly traded Indian companies listed on NSE and BSE. AI can make mistakes, check important information.
Research powered by GOALZEN CAPITAL SERVICES PRIVATE LIMITED · SEBI Research Analyst INH000013448
Prices might be delayed by a few minutes.
Join our Exclusive Community


Join our Exclusive Community
Made with 💙 in India. © Finsky Technologies Pvt Ltd. 2026


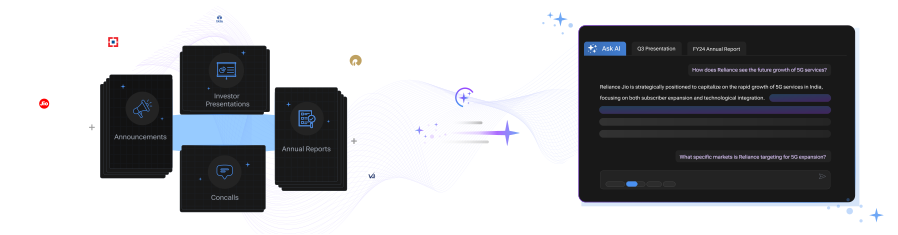
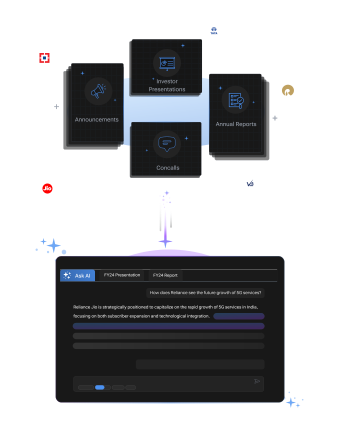
Get instant AI-powered insights about company performance, financials, and strategy. Ask questions about trends, competition, and developments while receiving responses backed by official documents and market data, with clear attribution to source documents.



 Discovery themes featuring this stock
Bearish
4
Neutral
6
Bullish
4
Bearish
17
Neutral
18
Bullish
11
Bearish
13
Neutral
12
Bullish
7
Bearish
4
Neutral
6
Bullish
4
Bearish
4
Neutral
6
Bullish
4
Bearish
13
Neutral
12
Bullish
7
Bearish
13
Neutral
12
Bullish
7
Bearish
13
Neutral
12
Bullish
7



Allcargo Global Limited is an asset-light, digital-first international supply chain company focused on Less Than Container Load (LCL) consolidation, Neutral Full Container Load (FCL) and Neutral Air cargo consolidation, operating via ECU Belgium N.V. and a global network of more than 300 offices across roughly 180 countries and ~2,400 direct trade lanes.
The company is a global LCL market leader with roughly 14.5% market share; its proprietary digital platform now processes about 70% of export bookings, giving Allcargo Global a meaningful technology moat to improve yield per cubic metre and to embed data science and automation into commercial and operational workflows.
Q1 FY27 showed sequential recovery and financial improvement: consolidated revenue of INR3,522 crores (up 5.8% YoY), gross profit of INR733 crores, and EBITDA turned positive at INR33 crores versus a loss a year ago, reflecting yield management, procurement efficiencies, and AI-led productivity initiatives driving margin recovery and reduced losses.
Management is explicitly focused on yield per unit (gross profit per CBM or TEU) rather than headline percentage gross margin, and is preparing for a base case of limited macro improvement while prioritising market share gains, cost control in dollar terms, working capital optimisation and selective non-core asset monetisation to reduce net debt.
Key structural exposures include concentration of FCL volumes in Middle East trade lanes (which have been negatively impacted by regional conflict), and a business model where growth and profitability are highly sensitive to global trade volumes and carrier capacity dynamics, making operational discipline and yield management vital.
Transport Services
Logistics Solution Provider
1,050 Cr
Low Risk
0.0
19.6
—
0.8
22.00
9.88
Sales CAGR
Profit CAGR
ROE
ROCE
View Standalone
View Standalone



Investor Presentation
Q1 FY27
Discovery themes featuring this stock

Allcargo Global Ltd (AGL) is currently trading at 10.99 per share. Stock prices fluctuate during market hours on NSE and BSE based on demand, company updates, and overall market conditions. Refer to the live price chart above for the most recent price movement.
Allcargo Global Limited is an asset-light, digital-first international supply chain company focused on Less Than Container Load (LCL) consolidation, Neutral Full Container Load (FCL) and Neutral Air cargo consolidation, operating via ECU Belgium N.V. and a global network of more than 300 offices across roughly 180 countries and ~2,400 direct trade lanes. The company is a global LCL market leader with roughly 14.5% market share; its proprietary digital platform now processes about 70% of export bookings, giving Allcargo Global a meaningful technology moat to improve yield per cubic metre and to embed data science and automation into commercial and operational workflows. Q1 FY27 showed sequential recovery and financial improvement: consolidated revenue of INR3,522 crores (up 5.8% YoY), gross profit of INR733 crores, and EBITDA turned positive at INR33 crores versus a loss a year ago, reflecting yield management, procurement efficiencies, and AI-led productivity initiatives driving margin recovery and reduced losses. Management is explicitly focused on yield per unit (gross profit per CBM or TEU) rather than headline percentage gross margin, and is preparing for a base case of limited macro improvement while prioritising market share gains, cost control in dollar terms, working capital optimisation and selective non-core asset monetisation to reduce net debt. Key structural exposures include concentration of FCL volumes in Middle East trade lanes (which have been negatively impacted by regional conflict), and a business model where growth and profitability are highly sensitive to global trade volumes and carrier capacity dynamics, making operational discipline and yield management vital.
Over the past 52 weeks, Allcargo Global Ltd has traded between a low of ₹9.88 and a high of ₹22.00. The 52-week high and low indicate the stock’s price range over the last year and help investors understand its volatility and recent trading levels.
Allcargo Global Ltd has a market capitalization of approximately 1,049.61. Market capitalization represents the total value of a company’s outstanding shares and helps investors understand its size, stability, and relative risk compared to other listed companies.
Allcargo Global Ltd’s investment profile depends on its business fundamentals, valuation, and long-term outlook. The stock currently trades at a PE ratio of N/A and operates in the its sector sector. Investors typically assess financial performance, growth prospects, and individual risk tolerance before making investment decisions.
Based on its market capitalization of 1,049.61 Cr, Allcargo Global Ltd is classified as a Small Cap stock. Large-cap stocks are generally more stable, while mid-cap and small-cap stocks tend to offer higher growth potential along with higher price volatility.
Allcargo Global Ltd operates in the its sector sector. Sector classification matters because companies in the same sector are often affected by similar economic conditions, regulatory changes, and competitive dynamics, which can influence overall stock performance.
The Price-to-Earnings (PE) ratio of Allcargo Global Ltd is N/A. The PE ratio compares a company’s share price to its earnings and is commonly used to assess valuation. Comparing the PE ratio with sector peers and historical levels provides better context.

| Symbol | Watchlist | Price | Market Cap | P/E | P/B | Div Yield (%) | ROE (%) | ROCE (%) | ROA (%) |
95.80 | 1,401 Cr | 25.99 | 1.92 | 0.71 | 12.33 | 14.15 | 6.00 | ||
9.19 | 1,363 Cr | 41.30 | 2.38 | 0.00 | 0.87 | 4.78 | 2.59 | ||
77.38 | 1,150 Cr | 12.75 | 0.58 | 0.00 | 2.39 | 3.77 | 1.97 | ||
10.99 | 1,050 Cr | -3.63 | 0.81 | 0.00 | — | — | 0.00 | ||
670.00 | 1,011 Cr | 85.21 | 2.18 | 0.52 | 2.56 | 3.03 | 2.34 | ||
94.93 | 951 Cr | 25.90 | 1.10 | 0.00 | 4.48 | 6.52 | 3.05 | ||
263.35 | 764 Cr | 28.89 | 2.10 | 0.00 | 9.87 | 8.89 | 3.07 | ||
| Median: 7 Co. | — | 94.93 | 1,050 Cr | 25.99 | 1.92 | 0.00 | 3.52 | 5.65 | 2.59 |


