



Actions
Action Type



Welcome to Multibagg AI
Log in to access personalized features
IRIS
Multibagg AI is an AI powered stock research and analysis platform. We provide data, information, content, and analytics for publicly traded Indian companies listed on NSE and BSE. AI can make mistakes, check important information.
Research powered by GOALZEN CAPITAL SERVICES PRIVATE LIMITED · SEBI Research Analyst INH000013448
Prices might be delayed by a few minutes.
Join our Exclusive Community


Join our Exclusive Community
Made with 💙 in India. © Finsky Technologies Pvt Ltd. 2026


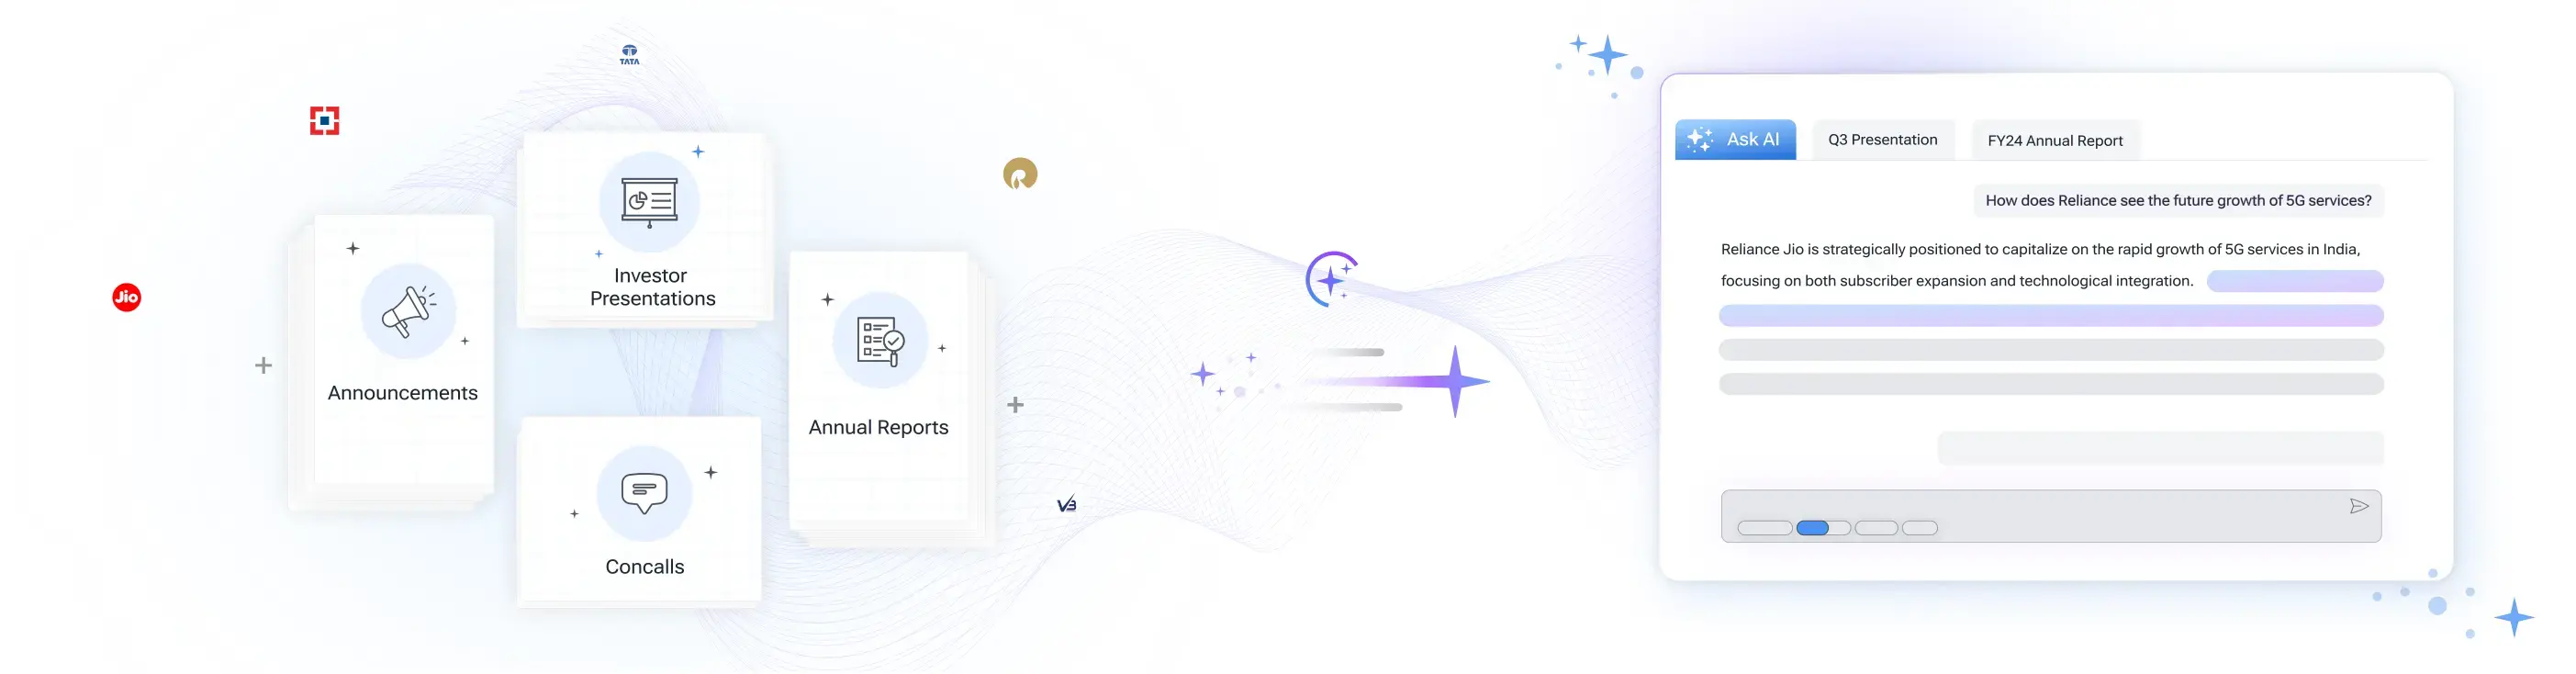
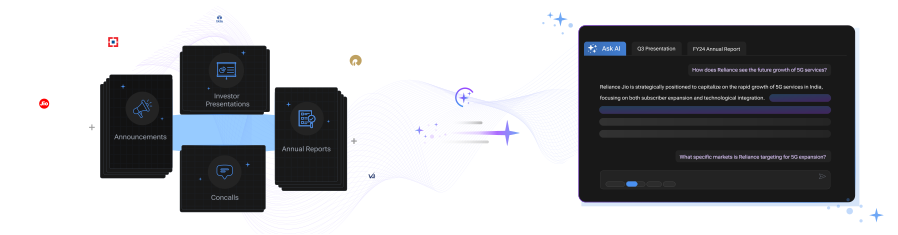
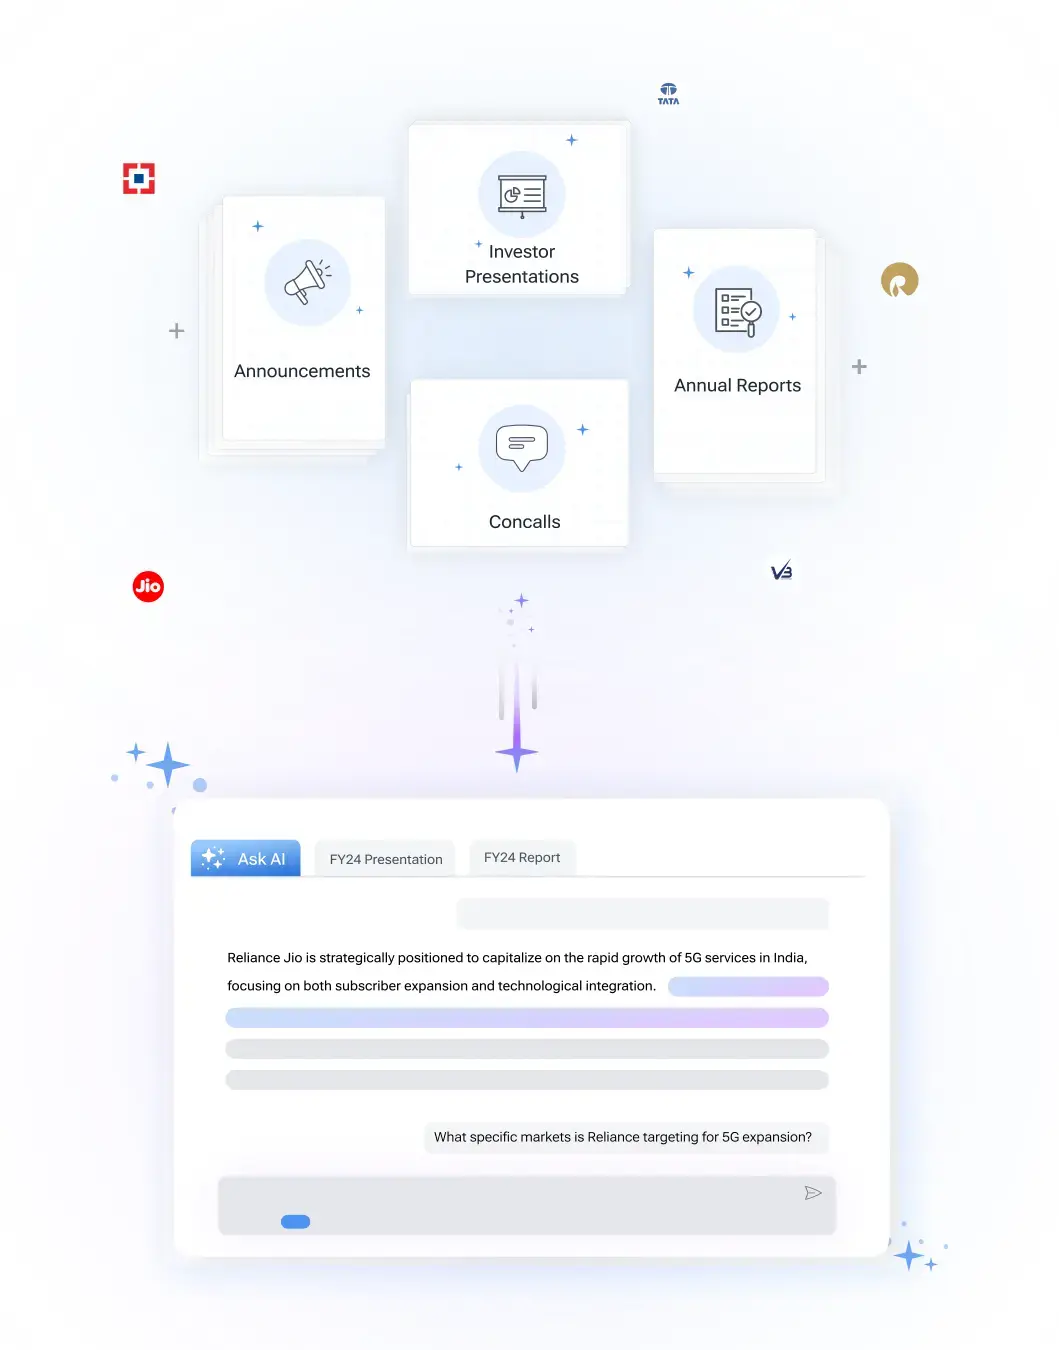
Get instant AI-powered insights about company performance, financials, and strategy. Ask questions about trends, competition, and developments while receiving responses backed by official documents and market data, with clear attribution to source documents.

 Discovery themes featuring this stock
Bearish
3
Neutral
1
Bullish
10
Bearish
35
Neutral
1
Bullish
10
Bearish
32
Neutral
0
Bullish
0
Bearish
3
Neutral
1
Bullish
10
Bearish
3
Neutral
1
Bullish
10
Bearish
32
Neutral
0
Bullish
0
Bearish
32
Neutral
0
Bullish
0
Bearish
32
Neutral
0
Bullish
0


Connplex Cinemas Limited develops, builds and franchises movie theatres under the CONNPLEX brand, and operates a mixed business of cinema development (EPC), film exhibition with revenue share, and ancillary income streams such as F&B, advertising and event rentals across express, signature and luxuriance formats.
FY26 marked rapid scale-up: 41 cinemas and 113 screens across nine states, a 63% YoY increase in footfalls to 27.63 lakh admits, average ticket price of ₹264, spend per head ₹95, reported revenue of ~₹147.5 crore (₹14,752 lakhs) and a net cash position of ₹7,615 lakhs with almost nil debt.
The company’s FY26 revenue mix is unusually balanced: cinema making / franchise fees (~₹64.81 crore) and ticketing (~₹62.13 crore) contributed similarly, while F&B and advertising are growing; Connplex also announced a process patent for non‑ECI servers connected to active LED screens which could differentiate its cinematic offering.
Margins compressed versus prior year due to elevated employee and marketing spends after the IPO and accelerated onboarding of franchise and development teams; management expects margin stabilization and operating leverage as newly opened screens scale and cost rationalization efforts are implemented across FY27 and beyond.
Connplex emphasizes asset‑light expansion via FOFO/FOCO franchises and lease‑sublease structures to retain operational control while conserving balance sheet capital, a strategy that supports faster rollouts, repeat franchise economics and diversified revenue streams beyond traditional ticketing.
Entertainment
Film Production, Distribution & Exhibition
417 Cr
Moderate Risk
16.0
30.5
0.1
3.3
311.90
188.40
Sales CAGR
Profit CAGR
ROE
ROCE



Investor Presentation
Q4 FY26
Investor Presentation
Q2 FY26



Connplex Cinemas Ltd (CONNPLEX) is currently trading at 218.45 per share. Stock prices fluctuate during market hours on NSE and BSE based on demand, company updates, and overall market conditions. Refer to the live price chart above for the most recent price movement.
Connplex Cinemas Limited develops, builds and franchises movie theatres under the CONNPLEX brand, and operates a mixed business of cinema development (EPC), film exhibition with revenue share, and ancillary income streams such as F&B, advertising and event rentals across express, signature and luxuriance formats. FY26 marked rapid scale-up: 41 cinemas and 113 screens across nine states, a 63% YoY increase in footfalls to 27.63 lakh admits, average ticket price of ₹264, spend per head ₹95, reported revenue of ~₹147.5 crore (₹14,752 lakhs) and a net cash position of ₹7,615 lakhs with almost nil debt. The company’s FY26 revenue mix is unusually balanced: cinema making / franchise fees (~₹64.81 crore) and ticketing (~₹62.13 crore) contributed similarly, while F&B and advertising are growing; Connplex also announced a process patent for non‑ECI servers connected to active LED screens which could differentiate its cinematic offering. Margins compressed versus prior year due to elevated employee and marketing spends after the IPO and accelerated onboarding of franchise and development teams; management expects margin stabilization and operating leverage as newly opened screens scale and cost rationalization efforts are implemented across FY27 and beyond. Connplex emphasizes asset‑light expansion via FOFO/FOCO franchises and lease‑sublease structures to retain operational control while conserving balance sheet capital, a strategy that supports faster rollouts, repeat franchise economics and diversified revenue streams beyond traditional ticketing.
Over the past 52 weeks, Connplex Cinemas Ltd has traded between a low of ₹188.40 and a high of ₹311.90. The 52-week high and low indicate the stock’s price range over the last year and help investors understand its volatility and recent trading levels.
Connplex Cinemas Ltd has a market capitalization of approximately 447.42. Market capitalization represents the total value of a company’s outstanding shares and helps investors understand its size, stability, and relative risk compared to other listed companies.
Connplex Cinemas Ltd’s investment profile depends on its business fundamentals, valuation, and long-term outlook. The stock currently trades at a PE ratio of 17.16 and operates in the its sector sector. Investors typically assess financial performance, growth prospects, and individual risk tolerance before making investment decisions.
Based on its market capitalization of 447.42 Cr, Connplex Cinemas Ltd is classified as a Small Cap stock. Large-cap stocks are generally more stable, while mid-cap and small-cap stocks tend to offer higher growth potential along with higher price volatility.
Connplex Cinemas Ltd operates in the its sector sector. Sector classification matters because companies in the same sector are often affected by similar economic conditions, regulatory changes, and competitive dynamics, which can influence overall stock performance.
The Price-to-Earnings (PE) ratio of Connplex Cinemas Ltd is 17.16. The PE ratio compares a company’s share price to its earnings and is commonly used to assess valuation. Comparing the PE ratio with sector peers and historical levels provides better context.


| Symbol | Watchlist | Price | Market Cap | P/E | P/B | Div Yield (%) | ROE (%) | ROCE (%) | ROA (%) |
218.45 | 447 Cr | 17.16 | 3.33 | 0.00 | 19.42 | 23.50 | 14.99 | ||
62.98 | 409 Cr | 160.26 | 2.76 | 0.00 | 2.14 | 2.00 | 1.17 | ||
86.20 | 346 Cr | -20.20 | 1.96 | 1.24 | 5.96 | 6.71 | -5.60 | ||
57.00 | 233 Cr | 9.70 | 0.72 | 0.00 | 7.66 | 10.89 | 3.76 | ||
125.10 | 219 Cr | -189.19 | 9.11 | 0.00 | -4.94 | -3.81 | -3.56 | ||
314.35 | 136 Cr | -2.72 | 4.55 | 0.00 | -53.03 | -6.94 | -20.69 | ||
46.30 | 122 Cr | -18.45 | 0.00 | 0.00 | 13.78 | 4.77 | -3.23 | ||
| Median: 7 Co. | — | 86.20 | 233 Cr | -2.72 | 2.76 | 0.00 | 5.96 | 4.77 | -3.23 |


