Regulatory/Compliance Filing
ITI Ltd Appointment of Statutory Auditors
ITI Ltd received a C&AG letter appointing six Chartered Accountant firms as Statutory/Branch Auditors for FY 2026-27; terms and particulars attached and acceptances received.



Welcome to Multibagg AI
Log in to access personalized features
IRIS
Multibagg AI is an AI powered stock research and analysis platform. We provide data, information, content, and analytics for publicly traded Indian companies listed on NSE and BSE. AI can make mistakes, check important information.
Research powered by GOALZEN CAPITAL SERVICES PRIVATE LIMITED · SEBI Research Analyst INH000013448
Prices might be delayed by a few minutes.
Join our Exclusive Community


Join our Exclusive Community
Made with 💙 in India. © Finsky Technologies Pvt Ltd. 2026


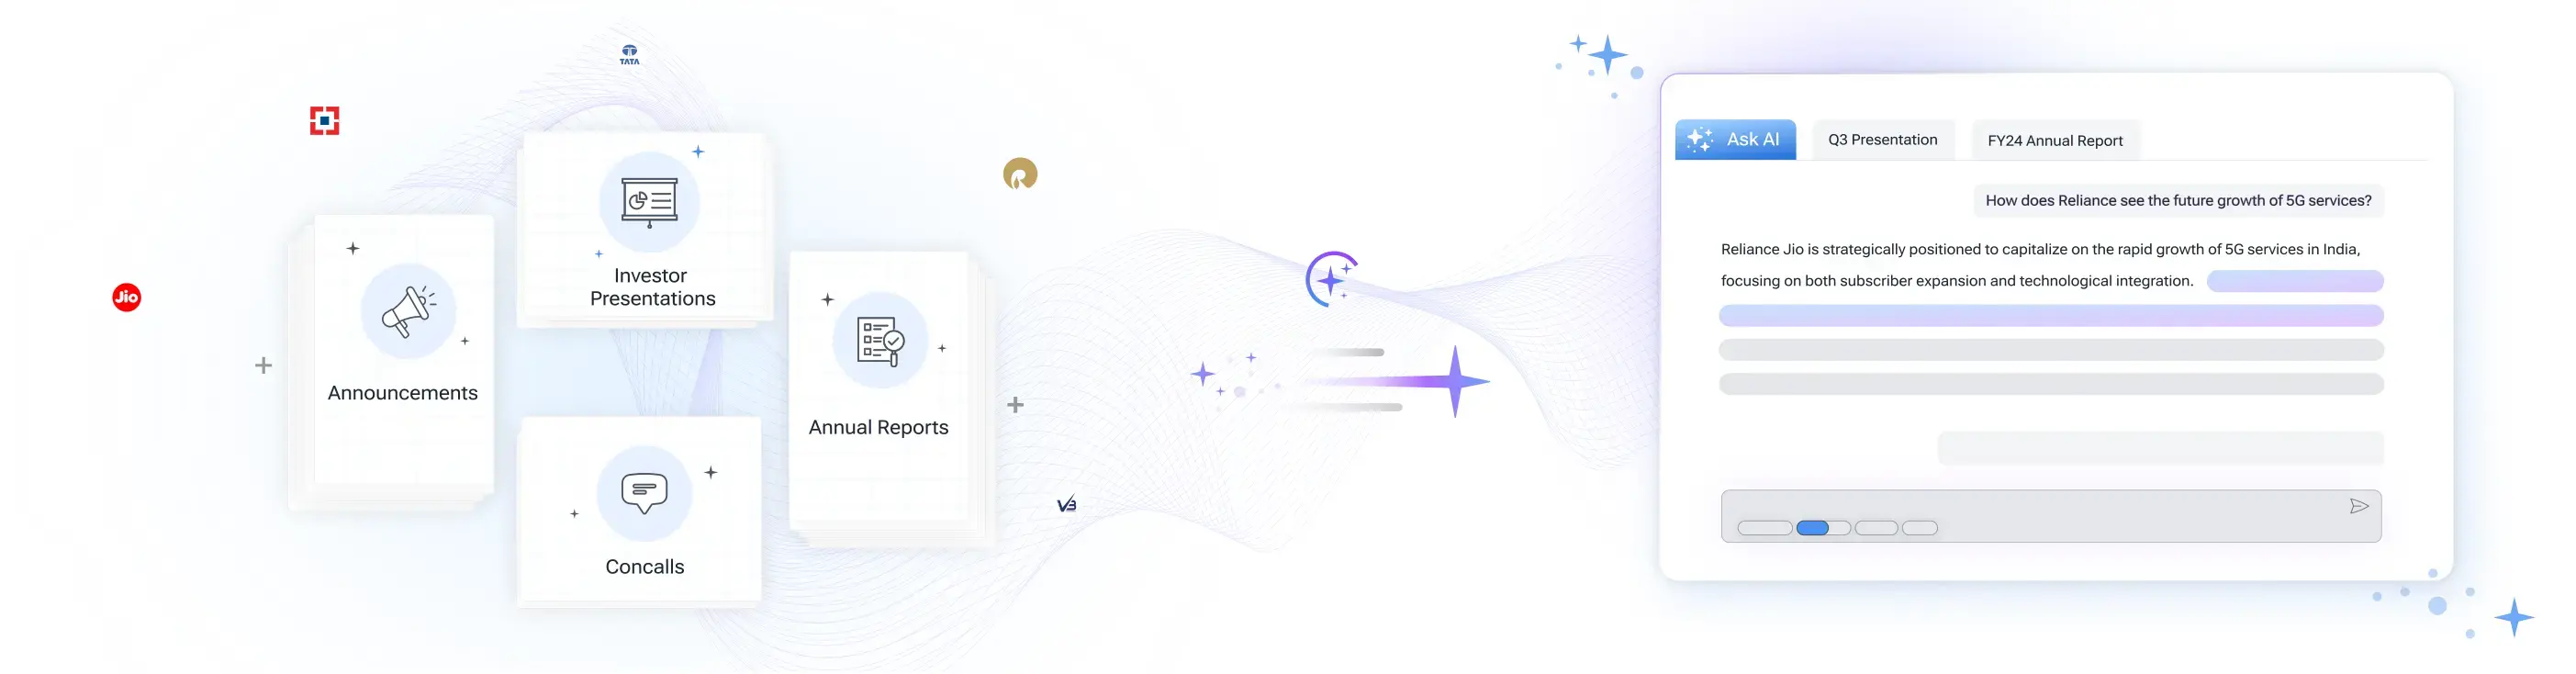
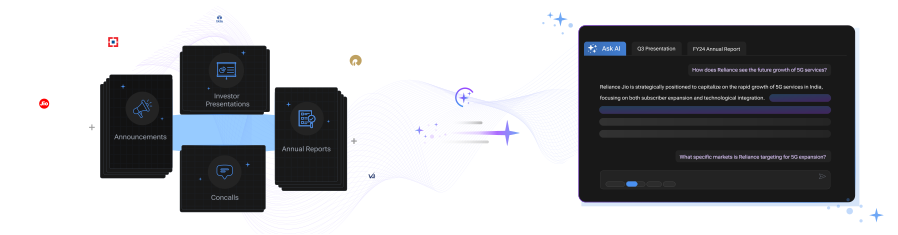
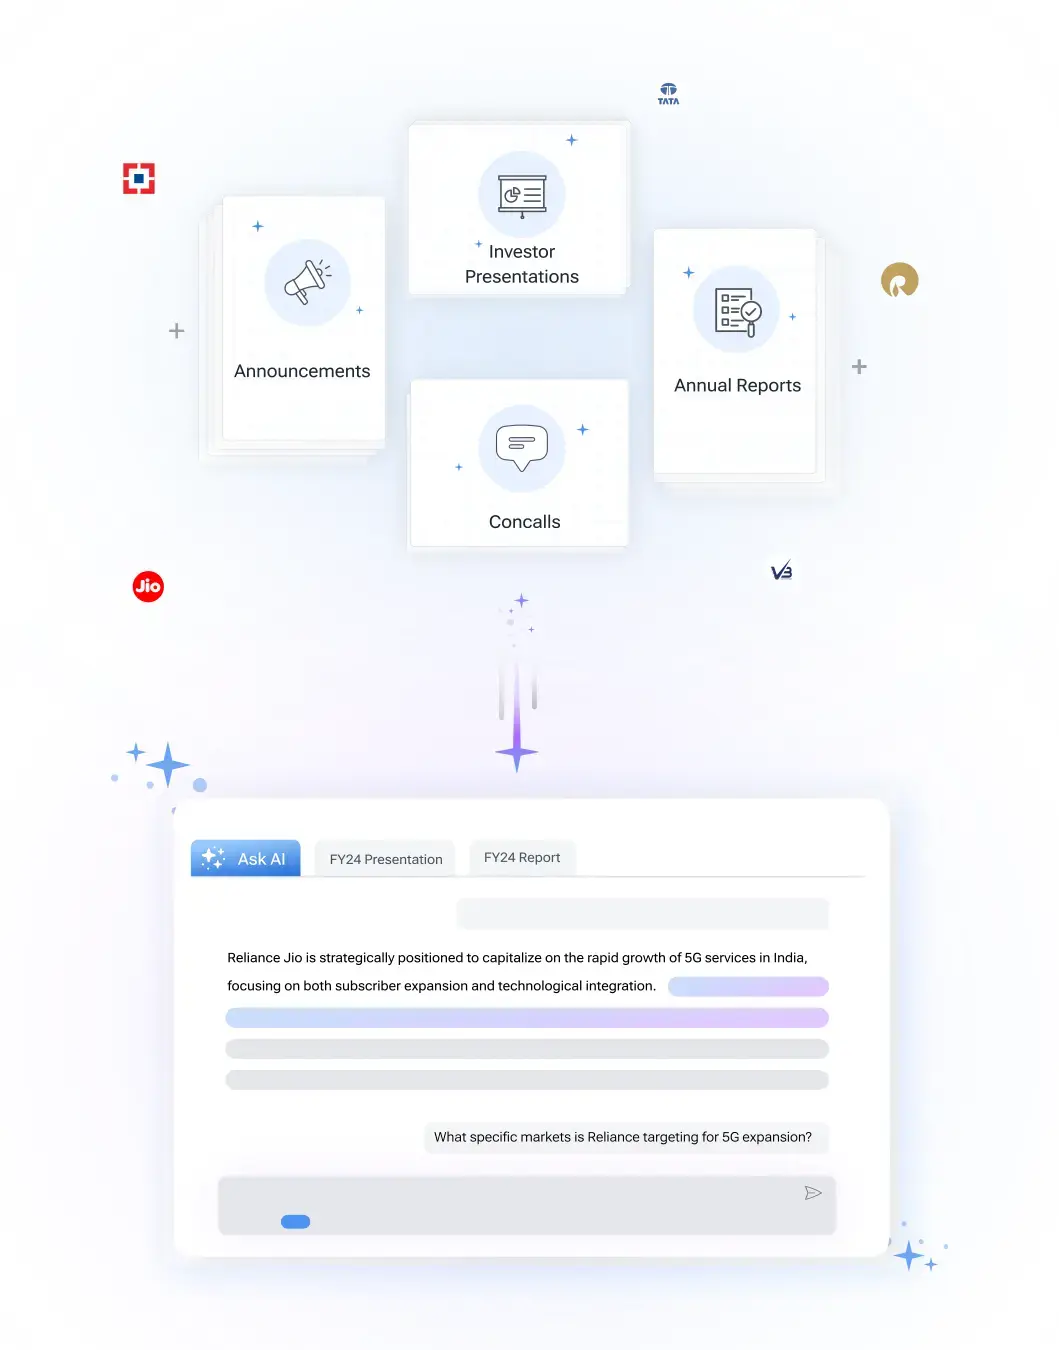
Get instant AI-powered insights about company performance, financials, and strategy. Ask questions about trends, competition, and developments while receiving responses backed by official documents and market data, with clear attribution to source documents.

 Discovery themes featuring this stock



Investor Presentation
Q3 FY26
Investor Presentation
Q1 FY26
Investor Presentation
Q3 FY20
Investor Presentation
Q3 FY19
| Symbol | Watchlist | Price | Market Cap | P/E | P/B | Div Yield (%) | ROE (%) | ROCE (%) | ROA (%) |
829.00 | 41,202 Cr | 54.50 | 11.31 | 0.00 | 2.10 | 7.39 | 3.83 | ||
215.45 | 21,888 Cr | 83.16 | 11.48 | 0.00 | -8.20 | 1.44 | 3.47 | ||
410.00 | 7,561 Cr | -9.25 | 3.00 | 0.00 | -32.33 | -10.88 | -9.68 | ||
682.95 | 6,529 Cr | 89.85 | 8.04 | 0.00 | 8.50 | 9.84 | 3.95 | ||
1370.00 | 1,731 Cr | 63.51 | 16.61 | 0.10 | 25.06 | 32.64 | 24.42 | ||
1989.80 | 939 Cr | 41.66 | 10.83 | 1.23 | 21.83 | 28.41 | 16.74 | ||
282.15 | 891 Cr | 19.27 | 3.17 | 0.42 | 6.02 | 8.46 | 9.95 | ||
| Median: 7 Co. | — | 682.95 | 6,529 Cr | 54.50 | 10.83 | 0.00 | 6.02 | 8.46 | 3.95 |
Bearish
5
Neutral
1
Bullish
8
Bearish
37
Neutral
1
Bullish
8
Bearish
32
Neutral
0
Bullish
0
Bearish
5
Neutral
1
Bullish
8
Bearish
5
Neutral
1
Bullish
8
Bearish
32
Neutral
0
Bullish
0
Bearish
32
Neutral
0
Bullish
0
Bearish
32
Neutral
0
Bullish
0


ITI Limited is an Indian public‑sector electronics manufacturer focused on telecom equipment, defence electronics, optical fibre and related infrastructure, operating manufacturing plants and R&D centers across Bangalore, Rae Bareli, Naini, Mankapur, Palakkad and Srinagar and supplying government telecom and defence projects.
The company holds a very large order‑book of Rs.13,88,281 lakhs (≈Rs.13,883 crore) anchored by the Army ASCON‑IV contract worth about Rs.8,280.36 crore and reports unbilled revenue of Rs.2,34,615 lakhs that management expects to convert within 12 months, lending strong short‑term revenue visibility.
Q1 FY2026‑27 reporting shows a consolidated net loss of Rs.3,225 lakhs and standalone loss of Rs.3,247 lakhs, while auditors issued a qualified/disclaimer review citing weak internal controls, inventory and receivable confirmations, and material uncertainty in several units which materially affects the financial statement reliability.
ITI Limited’s revival plan remains central: the company received ~Rs.3,08,435 lakhs of approved government financial assistance and completed a preferential allotment to the President of India, which together have financed capex including 4G RAN manufacturing lines and a 1,000‑rack data centre to pivot toward recurring services.
Operationally, ITI Limited is expanding manufacturing capabilities for OFC, HDPE ducts, ONTs and 4G RAN equipment while pursuing strategic MoUs (Tech Mahindra, TCS) and product initiatives (encryptors, FDMS, laptops, solar) that could diversify revenues beyond legacy PSU contracts.
Telecom - Equipment & Accessories
Telecom - Equipment & Accessories
21,888 Cr
Moderate Risk
83.2
124.2
—
11.5
340.05
213.80
Sales CAGR
Profit CAGR
ROE
ROCE
View Standalone
View Standalone
View Standalone
View Standalone
View Standalone
View Standalone
View Standalone
View Standalone
ITI Ltd (ITI) is currently trading at 215.45 per share. Stock prices fluctuate during market hours on NSE and BSE based on demand, company updates, and overall market conditions. Refer to the live price chart above for the most recent price movement.
ITI Limited is an Indian public‑sector electronics manufacturer focused on telecom equipment, defence electronics, optical fibre and related infrastructure, operating manufacturing plants and R&D centers across Bangalore, Rae Bareli, Naini, Mankapur, Palakkad and Srinagar and supplying government telecom and defence projects. The company holds a very large order‑book of Rs.13,88,281 lakhs (≈Rs.13,883 crore) anchored by the Army ASCON‑IV contract worth about Rs.8,280.36 crore and reports unbilled revenue of Rs.2,34,615 lakhs that management expects to convert within 12 months, lending strong short‑term revenue visibility. Q1 FY2026‑27 reporting shows a consolidated net loss of Rs.3,225 lakhs and standalone loss of Rs.3,247 lakhs, while auditors issued a qualified/disclaimer review citing weak internal controls, inventory and receivable confirmations, and material uncertainty in several units which materially affects the financial statement reliability. ITI Limited’s revival plan remains central: the company received ~Rs.3,08,435 lakhs of approved government financial assistance and completed a preferential allotment to the President of India, which together have financed capex including 4G RAN manufacturing lines and a 1,000‑rack data centre to pivot toward recurring services. Operationally, ITI Limited is expanding manufacturing capabilities for OFC, HDPE ducts, ONTs and 4G RAN equipment while pursuing strategic MoUs (Tech Mahindra, TCS) and product initiatives (encryptors, FDMS, laptops, solar) that could diversify revenues beyond legacy PSU contracts.
Over the past 52 weeks, ITI Ltd has traded between a low of ₹213.80 and a high of ₹340.05. The 52-week high and low indicate the stock’s price range over the last year and help investors understand its volatility and recent trading levels.
ITI Ltd has a market capitalization of approximately 21,887.79. Market capitalization represents the total value of a company’s outstanding shares and helps investors understand its size, stability, and relative risk compared to other listed companies.
ITI Ltd’s investment profile depends on its business fundamentals, valuation, and long-term outlook. The stock currently trades at a PE ratio of 83.16 and operates in the its sector sector. Investors typically assess financial performance, growth prospects, and individual risk tolerance before making investment decisions.
Based on its market capitalization of 21,887.79 Cr, ITI Ltd is classified as a Small Cap stock. Large-cap stocks are generally more stable, while mid-cap and small-cap stocks tend to offer higher growth potential along with higher price volatility.
ITI Ltd operates in the its sector sector. Sector classification matters because companies in the same sector are often affected by similar economic conditions, regulatory changes, and competitive dynamics, which can influence overall stock performance.
The Price-to-Earnings (PE) ratio of ITI Ltd is 83.16. The PE ratio compares a company’s share price to its earnings and is commonly used to assess valuation. Comparing the PE ratio with sector peers and historical levels provides better context.
ITI was cited at ₹286 on NSE and ₹285.8 on BSE as on 10 August 2026.
The most significant impact is the increase in the Electronics Components Manufacturing Scheme (ECMS) outlay to ₹40,000 crore. This directly supports ITI's core manufacturing operations, enhancing its cost-competitiveness and encouraging capacity expansion.