Earnings Call/Transcript
JSW Cement Result Call Oct 28 2026
JSW Cement Ltd scheduled a results conference call on 2026-10-28 at 10:30 AM IST to discuss unaudited standalone and consolidated Q2 and H1 FY27 financial results.



Welcome to Multibagg AI
Log in to access personalized features
IRIS
Multibagg AI is an AI powered stock research and analysis platform. We provide data, information, content, and analytics for publicly traded Indian companies listed on NSE and BSE. AI can make mistakes, check important information.
Research powered by GOALZEN CAPITAL SERVICES PRIVATE LIMITED · SEBI Research Analyst INH000013448
Prices might be delayed by a few minutes.
Join our Exclusive Community


Join our Exclusive Community
Made with 💙 in India. © Finsky Technologies Pvt Ltd. 2026


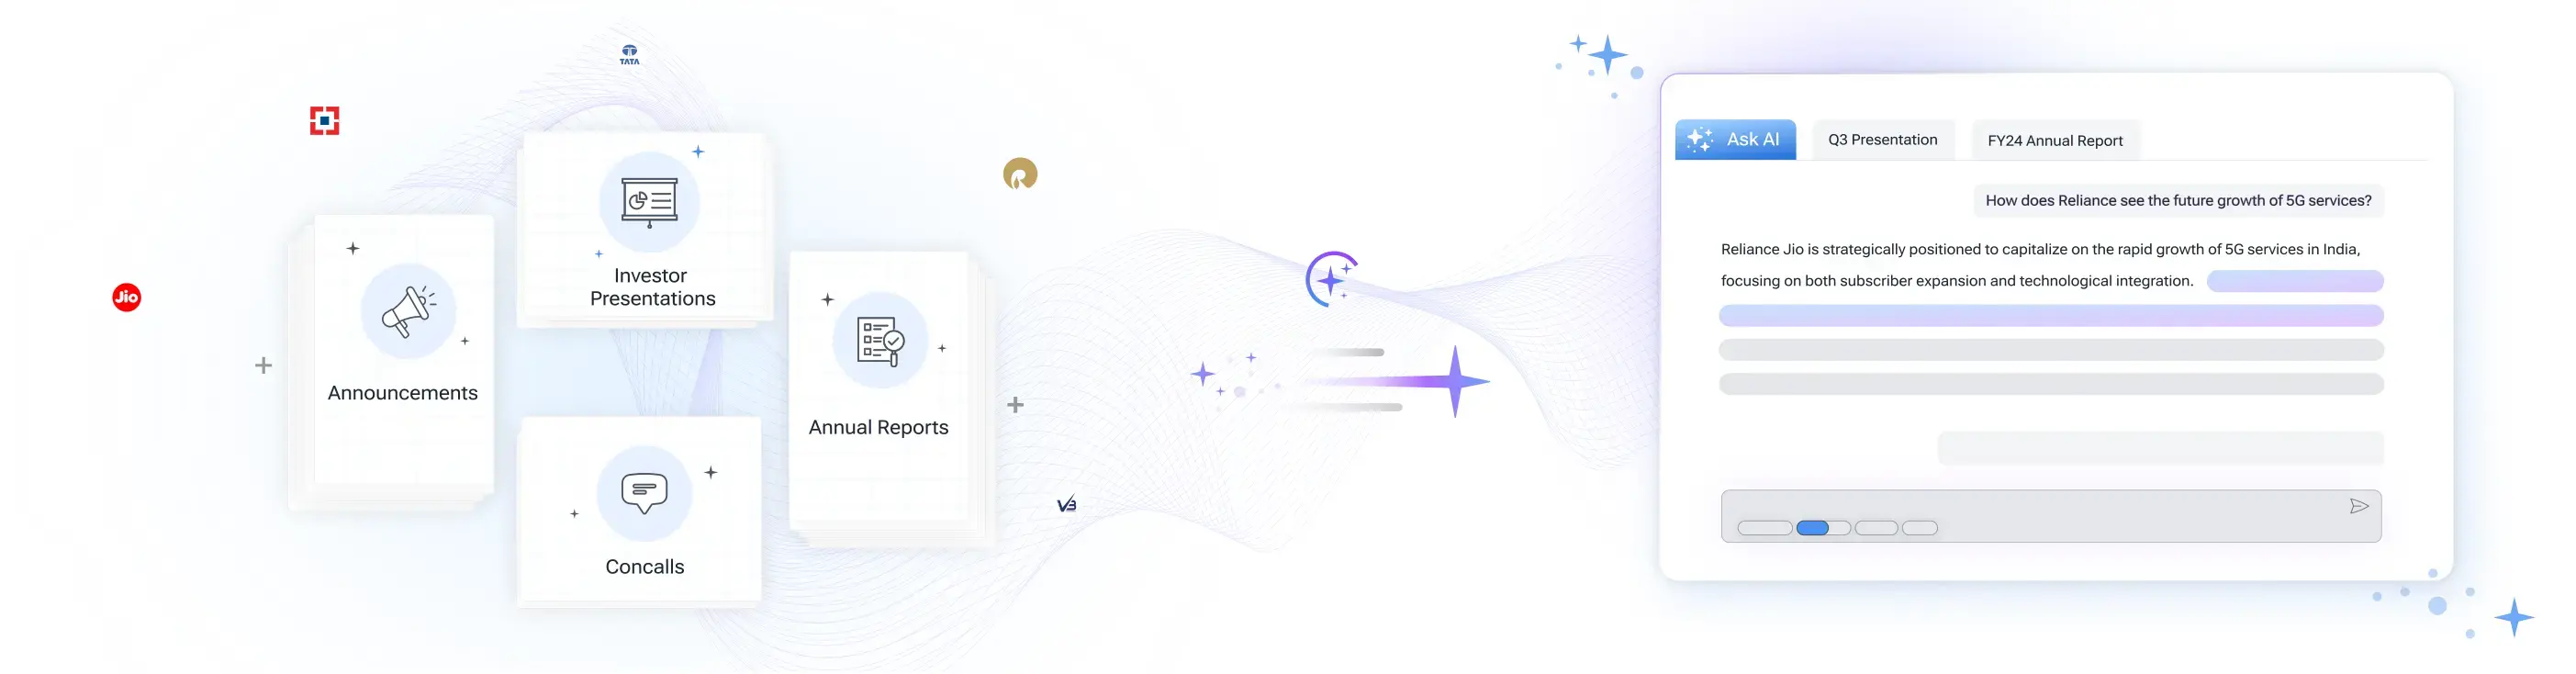
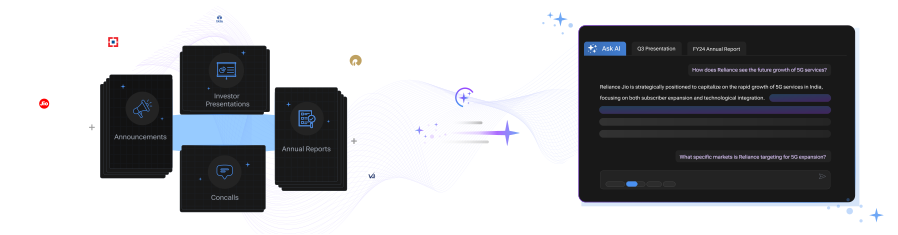
Get instant AI-powered insights about company performance, financials, and strategy. Ask questions about trends, competition, and developments while receiving responses backed by official documents and market data, with clear attribution to source documents.

 Discovery themes featuring this stock


Investor Presentation
Q4 FY26
Investor Presentation
Q4 FY26
Investor Presentation
Q3 FY26
Investor Presentation
Q2 FY26
Investor Presentation
Q1 FY26
Bearish
7
Neutral
4
Bullish
3
Bearish
21
Neutral
4
Bullish
21
Bearish
14
Neutral
0
Bullish
18
Bearish
7
Neutral
4
Bullish
3
Bearish
7
Neutral
4
Bullish
3
Bearish
14
Neutral
0
Bullish
18
Bearish
14
Neutral
0
Bullish
18
Bearish
14
Neutral
0
Bullish
18


JSW Cement is an integrated cement manufacturer focused on green cementitious products including blended cements and GGBS, with a multi‑regional presence across South, West, East, North India and manufacturing in UAE; the company operates 24.1 MTPA grinding and 9.74 MTPA clinker capacity and offers allied products such as RMC, screened slag and construction chemicals.
JSW Cement is the dominant GGBS producer in India with an estimated 84% market share and 5.78 MMT GGBS sold in FY26, positioning the company as the leading supplier to RMC and large infra projects and granting strong pricing and margin stability in the slag‑based product vertical.
The company is executing an aggressive capacity expansion programme approved to lift grinding to 43.3 MTPA (with potential to 68.3 MTPA) and clinker to 13.0 MTPA (potential 29.5 MTPA); near‑term projects like Nagaur are in commissioning/trial phases (Aug–Sep 2026), materially strengthening northern footprint and future volume growth.
Q1 FY27 showed strong volume growth (Total volume 3.81 MT, +15% YoY; cement volumes +26.5% YoY) and revenue growth (+21.6% YoY to ₹1,896 crore) but operating EBITDA per ton declined to ₹784 due to higher power & fuel, start‑up costs for North operations and increased marketing; net debt stood at ₹3,856 crore (Net Debt/TTM EBITDA 2.95x).
Sustainability credentials are a differentiator: one of the lowest CO2 intensity metrics in India (~268 kg/t), Science Based Targets alignment, an 86/100 Dow Jones CSA score ranking the company #1 globally in construction materials, and a significant renewable energy build‑out demonstrating strategic decarbonisation intent.
Cement & Cement Products
Cement & Cement Products
15,945 Cr
Moderate Risk
22.1
30.2
2.4
2.4
143.35
106.65
Sales CAGR
Profit CAGR
ROE
ROCE

Upcoming Result Date: Oct 26, 2026
View Standalone
View Standalone
View Standalone
View Standalone
View Standalone
View Standalone
View Standalone
View Standalone
| Symbol | Watchlist | Price | Market Cap | P/E | P/B | Div Yield (%) | ROE (%) | ROCE (%) | ROA (%) |
1158.55 | 21,756 Cr | 11.40 | 1.06 | 0.65 | 10.40 | 10.75 | 6.93 | ||
739.15 | 17,466 Cr | 27.35 | 2.16 | 0.34 | 3.20 | 6.16 | 3.84 | ||
116.95 | 15,945 Cr | 22.11 | 2.43 | 4.21 | 11.15 | 9.99 | 4.96 | ||
330.60 | 11,808 Cr | 28.48 | 1.23 | 0.00 | 4.34 | 6.59 | 1.94 | ||
315.30 | 9,771 Cr | 79.76 | 2.00 | 0.00 | 1.56 | 2.49 | 0.89 | ||
160.35 | 6,481 Cr | 17.70 | 2.03 | 1.25 | 12.33 | 15.20 | 7.88 | ||
777.85 | 5,990 Cr | 10.82 | 0.94 | 1.61 | 7.57 | 8.97 | 3.82 | ||
| Median: 7 Co. | — | 330.60 | 11,808 Cr | 22.11 | 2.00 | 0.65 | 7.57 | 8.97 | 3.84 |



JSW Cement Ltd (JSWCEMENT) is currently trading at 117.05 per share. Stock prices fluctuate during market hours on NSE and BSE based on demand, company updates, and overall market conditions. Refer to the live price chart above for the most recent price movement.
JSW Cement is an integrated cement manufacturer focused on green cementitious products including blended cements and GGBS, with a multi‑regional presence across South, West, East, North India and manufacturing in UAE; the company operates 24.1 MTPA grinding and 9.74 MTPA clinker capacity and offers allied products such as RMC, screened slag and construction chemicals. JSW Cement is the dominant GGBS producer in India with an estimated 84% market share and 5.78 MMT GGBS sold in FY26, positioning the company as the leading supplier to RMC and large infra projects and granting strong pricing and margin stability in the slag‑based product vertical. The company is executing an aggressive capacity expansion programme approved to lift grinding to 43.3 MTPA (with potential to 68.3 MTPA) and clinker to 13.0 MTPA (potential 29.5 MTPA); near‑term projects like Nagaur are in commissioning/trial phases (Aug–Sep 2026), materially strengthening northern footprint and future volume growth. Q1 FY27 showed strong volume growth (Total volume 3.81 MT, +15% YoY; cement volumes +26.5% YoY) and revenue growth (+21.6% YoY to ₹1,896 crore) but operating EBITDA per ton declined to ₹784 due to higher power & fuel, start‑up costs for North operations and increased marketing; net debt stood at ₹3,856 crore (Net Debt/TTM EBITDA 2.95x). Sustainability credentials are a differentiator: one of the lowest CO2 intensity metrics in India (~268 kg/t), Science Based Targets alignment, an 86/100 Dow Jones CSA score ranking the company #1 globally in construction materials, and a significant renewable energy build‑out demonstrating strategic decarbonisation intent.
Over the past 52 weeks, JSW Cement Ltd has traded between a low of ₹106.65 and a high of ₹143.35. The 52-week high and low indicate the stock’s price range over the last year and help investors understand its volatility and recent trading levels.
JSW Cement Ltd has a market capitalization of approximately 15,944.55. Market capitalization represents the total value of a company’s outstanding shares and helps investors understand its size, stability, and relative risk compared to other listed companies.
JSW Cement Ltd’s investment profile depends on its business fundamentals, valuation, and long-term outlook. The stock currently trades at a PE ratio of 22.11 and operates in the its sector sector. Investors typically assess financial performance, growth prospects, and individual risk tolerance before making investment decisions.
Based on its market capitalization of 15,944.55 Cr, JSW Cement Ltd is classified as a Small Cap stock. Large-cap stocks are generally more stable, while mid-cap and small-cap stocks tend to offer higher growth potential along with higher price volatility.
JSW Cement Ltd operates in the its sector sector. Sector classification matters because companies in the same sector are often affected by similar economic conditions, regulatory changes, and competitive dynamics, which can influence overall stock performance.
The Price-to-Earnings (PE) ratio of JSW Cement Ltd is 22.11. The PE ratio compares a company’s share price to its earnings and is commonly used to assess valuation. Comparing the PE ratio with sector peers and historical levels provides better context.
The provided information says JSW Cement received Sebi’s final observation to raise Rs 4,000 crore through an IPO that includes a fresh issue and an offer for sale.
It approved a Scheme of Arrangement to amalgamate Shiva Cement into JSW Cement and to reorganise reserves, subject to shareholder, NCLT, and other approvals.
JSW Cement reported consolidated net profit attributable to owners of ₹160.64 crore in Q1 FY27, compared with a loss of ₹1,356.17 crore in Q1 FY26.
The new greenfield plant in Nagaur has a clinkerisation capacity of 3.30 million tonnes per annum (MTPA) and a cement grinding capacity of 2.50 MTPA.