Regulatory/Compliance Filing
Mahindra Lifespaces Publishes Share Transfer Notice
Mahindra Lifespace Developers published newspaper advertisements regarding the special window for re-lodgement of transfer requests for physical shares.





Welcome to Multibagg AI
Log in to access personalized features
IRIS
Multibagg AI is an AI powered stock research and analysis platform. We provide data, information, content, and analytics for publicly traded Indian companies listed on NSE and BSE. AI can make mistakes, check important information.
Prices might be delayed by a few minutes.
Join our Exclusive Community


Join our Exclusive Community
Made with 💙 in India. © Finsky Technologies Pvt Ltd. 2026


Get instant AI-powered insights about company performance, financials, and strategy. Ask questions about trends, competition, and developments while receiving responses backed by official documents and market data, with clear attribution to source documents.





 Discovery themes featuring this stock
Bearish
3
Neutral
6
Bullish
5
Bearish
30
Neutral
6
Bullish
10
Bearish
27
Neutral
0
Bullish
5
Bearish
27
Neutral
0
Bullish
5
Bearish
27
Neutral
0
Bullish
5
Bearish
27
Neutral
0
Bullish
5
Discovery themes featuring this stock| Symbol | Watchlist | Price | Market Cap | P/E | P/B | Div Yield (%) | ROE (%) | ROCE (%) | ROA (%) |
498.35 | 8,152 Cr | 674.83 | 3.37 | 0.00 | 0.52 | 1.27 | 0.10 | ||
1173.05 | 7,809 Cr | 95.31 | 2.47 | 0.00 | 2.25 | 5.12 | 1.59 | ||
53.38 | 7,597 Cr | -7.10 | 0.74 | 0.00 | -8.84 | -2.11 | -4.41 | ||
307.40 | 6,561 Cr | 21.80 | 1.79 | 1.14 | 8.22 | 9.00 | 3.56 | ||
649.95 | 5,420 Cr | 24.20 | 2.23 | 0.23 | 9.23 | 11.88 | 6.46 | ||
236.05 | 4,861 Cr | 179.24 | 1.21 | 0.00 | 1.32 | 0.74 | 0.14 | ||
200.20 | 4,748 Cr | 17.12 | 2.50 | 0.00 | 9.02 | 12.39 | 1.51 | ||
| Median: 7 Co. | — | 307.40 | 6,561 Cr | 24.20 | 2.23 | 0.00 | 2.25 | 5.12 | 1.51 |


Mahindra Lifespace Developers is an Indian real estate developer focused on premium and mid-premium residential projects, integrated cities, and industrial clusters. Its principal markets are Mumbai, Pune, and Bengaluru for residential development, while Mahindra World City and Origins platforms serve industrial and business-location requirements across Chennai, Ahmedabad, Jaipur, and Pune.
Residential pre-sales reached approximately ₹1,988 crore in H1 FY27, representing 66% year-on-year growth, supported by Rainforest, BeaconHill, Citadel Phase 3, and Lakewoods. Sustenance sales contributed roughly 41% of total sales, indicating that the business is becoming less dependent on large launch events and is building a more repeatable sales engine.
The company has accumulated approximately ₹50,000 crore of gross development value, including ₹7,100 crore added during H1 FY27. Recent additions include the ₹5,600 crore K2 greenfield project in Kandivali, expanded society-redevelopment clusters in Chembur and Borivali, and additional pipeline projects intended to prevent excessive depletion of future launch inventory.
Financial discipline remains a major differentiator: H1 FY27 PAT was ₹102 crore, operating cash flow was ₹341 crore, net debt-to-equity was negative 0.28, and cost of debt was 7.55%. Management also highlighted ₹1,036 crore of closing cash and approximately ₹600 crore of borrowings, suggesting substantial capacity to fund measured growth.
Management expects FY27 residential pre-sales of approximately ₹4,500–₹5,000 crore, with Mahalunge, Sai Baba, Navrat, Westera, and other projects supporting H2. However, approvals and market velocity remain important execution variables, while industrial-commercial performance is expected to improve as committed deals close and leasing activity recovers.
Realty
Residential, Commercial Projects
6,561 Cr
Moderate Risk
21.8
33.6
1.4
1.8
428.35
288.00
Sales CAGR
Profit CAGR
ROE
ROCE
View Standalone
View Standalone
View Standalone
View Standalone
View Standalone
View Standalone
View Standalone
View Standalone



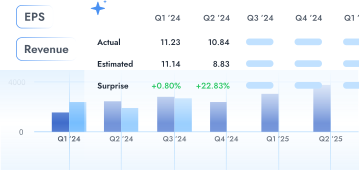




Mahindra Lifespace Developers Ltd (MAHLIFE) is currently trading at 313.30 per share. Stock prices fluctuate during market hours on NSE and BSE based on demand, company updates, and overall market conditions. Refer to the live price chart above for the most recent price movement.
Mahindra Lifespace Developers is an Indian real estate developer focused on premium and mid-premium residential projects, integrated cities, and industrial clusters. Its principal markets are Mumbai, Pune, and Bengaluru for residential development, while Mahindra World City and Origins platforms serve industrial and business-location requirements across Chennai, Ahmedabad, Jaipur, and Pune. Residential pre-sales reached approximately ₹1,988 crore in H1 FY27, representing 66% year-on-year growth, supported by Rainforest, BeaconHill, Citadel Phase 3, and Lakewoods. Sustenance sales contributed roughly 41% of total sales, indicating that the business is becoming less dependent on large launch events and is building a more repeatable sales engine. The company has accumulated approximately ₹50,000 crore of gross development value, including ₹7,100 crore added during H1 FY27. Recent additions include the ₹5,600 crore K2 greenfield project in Kandivali, expanded society-redevelopment clusters in Chembur and Borivali, and additional pipeline projects intended to prevent excessive depletion of future launch inventory. Financial discipline remains a major differentiator: H1 FY27 PAT was ₹102 crore, operating cash flow was ₹341 crore, net debt-to-equity was negative 0.28, and cost of debt was 7.55%. Management also highlighted ₹1,036 crore of closing cash and approximately ₹600 crore of borrowings, suggesting substantial capacity to fund measured growth. Management expects FY27 residential pre-sales of approximately ₹4,500–₹5,000 crore, with Mahalunge, Sai Baba, Navrat, Westera, and other projects supporting H2. However, approvals and market velocity remain important execution variables, while industrial-commercial performance is expected to improve as committed deals close and leasing activity recovers.
Over the past 52 weeks, Mahindra Lifespace Developers Ltd has traded between a low of ₹288.00 and a high of ₹428.35. The 52-week high and low indicate the stock’s price range over the last year and help investors understand its volatility and recent trading levels.
Mahindra Lifespace Developers Ltd has a market capitalization of approximately 6,560.77. Market capitalization represents the total value of a company’s outstanding shares and helps investors understand its size, stability, and relative risk compared to other listed companies.
Mahindra Lifespace Developers Ltd’s investment profile depends on its business fundamentals, valuation, and long-term outlook. The stock currently trades at a PE ratio of 21.80 and operates in the its sector sector. Investors typically assess financial performance, growth prospects, and individual risk tolerance before making investment decisions.
Based on its market capitalization of 6,560.77 Cr, Mahindra Lifespace Developers Ltd is classified as a Small Cap stock. Large-cap stocks are generally more stable, while mid-cap and small-cap stocks tend to offer higher growth potential along with higher price volatility.
Mahindra Lifespace Developers Ltd operates in the its sector sector. Sector classification matters because companies in the same sector are often affected by similar economic conditions, regulatory changes, and competitive dynamics, which can influence overall stock performance.
The Price-to-Earnings (PE) ratio of Mahindra Lifespace Developers Ltd is 21.80. The PE ratio compares a company’s share price to its earnings and is commonly used to assess valuation. Comparing the PE ratio with sector peers and historical levels provides better context.
Q2 FY27 consolidated net profit (PAT) was INR 16.34 crore, down 65.9% from INR 47.91 crore in Q2 FY26.
Q2 FY27 consolidated net profit was INR 16.34 crore versus INR 47.91 crore a year ago, while total income rose to INR 104.02 crore from INR 33.06 crore.
The company has scheduled the Q1 FY27 earnings conference call for July 24, 2026 at 3:30 PM IST via video conferencing from Mumbai.
FY26 consolidated sales were ₹4,118 crore and consolidated PAT (after non-controlling interest) was ₹298 crore, as per the company’s FY26 results release.