Actions
Action Type



Welcome to Multibagg AI
Log in to access personalized features
IRIS
Multibagg AI is an AI powered stock research and analysis platform. We provide data, information, content, and analytics for publicly traded Indian companies listed on NSE and BSE. AI can make mistakes, check important information.
Research powered by GOALZEN CAPITAL SERVICES PRIVATE LIMITED · SEBI Research Analyst INH000013448
Prices might be delayed by a few minutes.
Join our Exclusive Community


Join our Exclusive Community
Made with 💙 in India. © Finsky Technologies Pvt Ltd. 2026


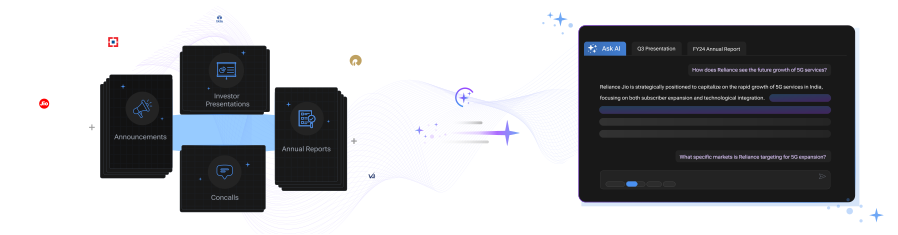
Get instant AI-powered insights about company performance, financials, and strategy. Ask questions about trends, competition, and developments while receiving responses backed by official documents and market data, with clear attribution to source documents.



 Discovery themes featuring this stock
Bearish
4
Neutral
2
Bullish
8
Bearish
33
Neutral
2
Bullish
11
Bearish
29
Neutral
0
Bullish
3
Bearish
4
Neutral
2
Bullish
8
Bearish
4
Neutral
2
Bullish
8
Bearish
29
Neutral
0
Bullish
3
Bearish
29
Neutral
0
Bullish
3
Bearish
29
Neutral
0
Bullish
3


Navin Fluorine International Limited is an integrated fluorochemicals company with nearly six decades of fluorine chemistry expertise, manufacturing refrigerants, specialty organofluorines, inorganic fluorides and operating a global CDMO business across multiple Indian sites and a UK subsidiary, serving pharma, agro and industrial customers.
Q1 FY27 delivered Rs.1,045.1 crore revenue (+44% YoY) and Operating EBITDA Rs.357.1 crore (+73% YoY) with consolidated operating margin of 34.2% (up 566 bps YoY); growth was broad‑based led by HPP (+33% YoY), Specialty (+48% YoY) and CDMO/CRMO (+82% YoY), demonstrating strong topline and margin expansion.
The company is executing a multi‑layered capex program: additional HFC capacity (Rs.236.5 crore), cGMP4 expansion (Phase II Rs.125 crore), MPP de‑bottlenecking (Rs.75 crore), and an Advanced Materials vertical (Rs.90 crore) plus a Chemours‑linked commercialisation project (Rs.120 crore) to target higher‑margin, new end markets like semiconductors and data center cooling.
CDMO momentum is a standout: revenue from CRMO rose 82% YoY with board‑approved cGMP4 investments and active deepening engagement with a European CDMO major; management targets asset turnover of ~3x for cGMP4 phase II, implying significant incremental profitability from contract manufacturing ramp.
Navin Fluorine International Limited is also advancing sustainability and governance initiatives with a hybrid renewable project (14.9 MW investment), ESG targets including 50% renewable electricity by 2030, and structured board governance and succession practices supporting scalable, compliant growth.
Chemicals & Petrochemicals
Specialty Chemicals
39,405 Cr
Low Risk
49.9
35.0
2.8
9.9
8,949.00
4,889.45
Sales CAGR
Profit CAGR
ROE
ROCE

Upcoming Result Date: Oct 29, 2026
View Standalone
View Standalone
View Standalone
View Standalone
View Standalone
View Standalone
View Standalone
View Standalone
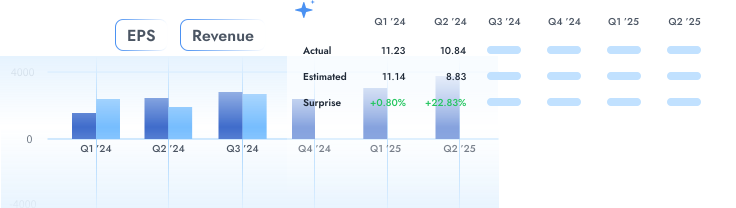
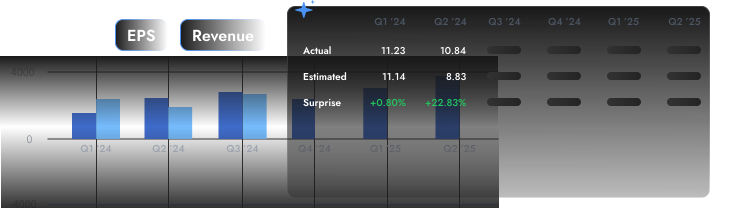






Navin Fluorine International Ltd (NAVINFLUOR) is currently trading at 7,679.05 per share. Stock prices fluctuate during market hours on NSE and BSE based on demand, company updates, and overall market conditions. Refer to the live price chart above for the most recent price movement.
Navin Fluorine International Limited is an integrated fluorochemicals company with nearly six decades of fluorine chemistry expertise, manufacturing refrigerants, specialty organofluorines, inorganic fluorides and operating a global CDMO business across multiple Indian sites and a UK subsidiary, serving pharma, agro and industrial customers. Q1 FY27 delivered Rs.1,045.1 crore revenue (+44% YoY) and Operating EBITDA Rs.357.1 crore (+73% YoY) with consolidated operating margin of 34.2% (up 566 bps YoY); growth was broad‑based led by HPP (+33% YoY), Specialty (+48% YoY) and CDMO/CRMO (+82% YoY), demonstrating strong topline and margin expansion. The company is executing a multi‑layered capex program: additional HFC capacity (Rs.236.5 crore), cGMP4 expansion (Phase II Rs.125 crore), MPP de‑bottlenecking (Rs.75 crore), and an Advanced Materials vertical (Rs.90 crore) plus a Chemours‑linked commercialisation project (Rs.120 crore) to target higher‑margin, new end markets like semiconductors and data center cooling. CDMO momentum is a standout: revenue from CRMO rose 82% YoY with board‑approved cGMP4 investments and active deepening engagement with a European CDMO major; management targets asset turnover of ~3x for cGMP4 phase II, implying significant incremental profitability from contract manufacturing ramp. Navin Fluorine International Limited is also advancing sustainability and governance initiatives with a hybrid renewable project (14.9 MW investment), ESG targets including 50% renewable electricity by 2030, and structured board governance and succession practices supporting scalable, compliant growth.
Over the past 52 weeks, Navin Fluorine International Ltd has traded between a low of ₹4,889.45 and a high of ₹8,949.00. The 52-week high and low indicate the stock’s price range over the last year and help investors understand its volatility and recent trading levels.
Navin Fluorine International Ltd has a market capitalization of approximately 39,404.75. Market capitalization represents the total value of a company’s outstanding shares and helps investors understand its size, stability, and relative risk compared to other listed companies.
Navin Fluorine International Ltd’s investment profile depends on its business fundamentals, valuation, and long-term outlook. The stock currently trades at a PE ratio of 49.90 and operates in the its sector sector. Investors typically assess financial performance, growth prospects, and individual risk tolerance before making investment decisions.
Based on its market capitalization of 39,404.75 Cr, Navin Fluorine International Ltd is classified as a Mid Cap stock. Large-cap stocks are generally more stable, while mid-cap and small-cap stocks tend to offer higher growth potential along with higher price volatility.
Navin Fluorine International Ltd operates in the its sector sector. Sector classification matters because companies in the same sector are often affected by similar economic conditions, regulatory changes, and competitive dynamics, which can influence overall stock performance.
The Price-to-Earnings (PE) ratio of Navin Fluorine International Ltd is 49.90. The PE ratio compares a company’s share price to its earnings and is commonly used to assess valuation. Comparing the PE ratio with sector peers and historical levels provides better context.
Navin Fluorine’s Board meeting to approve unaudited Q1 FY27 results is scheduled for August 05, 2026.
Navin Fluorine was reported trading at ₹7,680.75 on Jul 06, 2026 (08:21:15), up 1.57% from the previous close of ₹7,562.15.
Standalone revenue from operations was ₹626.51 crore and standalone profit after tax was ₹135.03 crore in Q4 FY26.
The feed mentions earnings “Expected on 29/04/2026” and also says the board is scheduled to meet in May 2026 (expected) to approve audited statements.

| Symbol | Watchlist | Price | Market Cap | P/E | P/B | Div Yield (%) | ROE (%) | ROCE (%) | ROA (%) |
4239.70 | 46,573 Cr | 76.47 | 5.96 | 0.07 | 7.13 | 8.93 | 5.05 | ||
7679.05 | 39,405 Cr | 49.90 | 9.91 | 0.11 | 16.69 | 18.14 | 12.38 | ||
1447.20 | 19,739 Cr | 25.20 | 3.38 | 0.52 | 9.43 | 10.74 | 9.02 | ||
1413.95 | 18,767 Cr | 79.79 | 7.64 | 0.00 | 8.94 | 10.61 | 7.35 | ||
5578.40 | 16,424 Cr | 20.86 | 2.64 | 0.54 | 11.73 | 15.82 | 9.35 | ||
427.20 | 15,496 Cr | 29.18 | 2.60 | 0.23 | 7.04 | 6.41 | 3.99 | ||
5054.00 | 15,496 Cr | 35.37 | 5.82 | 0.22 | 15.65 | 20.00 | 14.61 | ||
| Median: 7 Co. | — | 4239.70 | 18,767 Cr | 35.37 | 5.82 | 0.22 | 9.43 | 10.74 | 9.02 |