






Earnings Call/Transcript
Redington Schedules Q2 FY27 Earnings Call
Redington will hold an earnings conference call on November 4, 2026, at 5:30 PM IST to discuss its Q2 FY27 financial results.



Welcome to Multibagg AI
Log in to access personalized features
IRIS
Multibagg AI is an AI powered stock research and analysis platform. We provide data, information, content, and analytics for publicly traded Indian companies listed on NSE and BSE. AI can make mistakes, check important information.
Research powered by GOALZEN CAPITAL SERVICES PRIVATE LIMITED · SEBI Research Analyst INH000013448
Prices might be delayed by a few minutes.
Join our Exclusive Community


Join our Exclusive Community
Made with 💙 in India. © Finsky Technologies Pvt Ltd. 2026


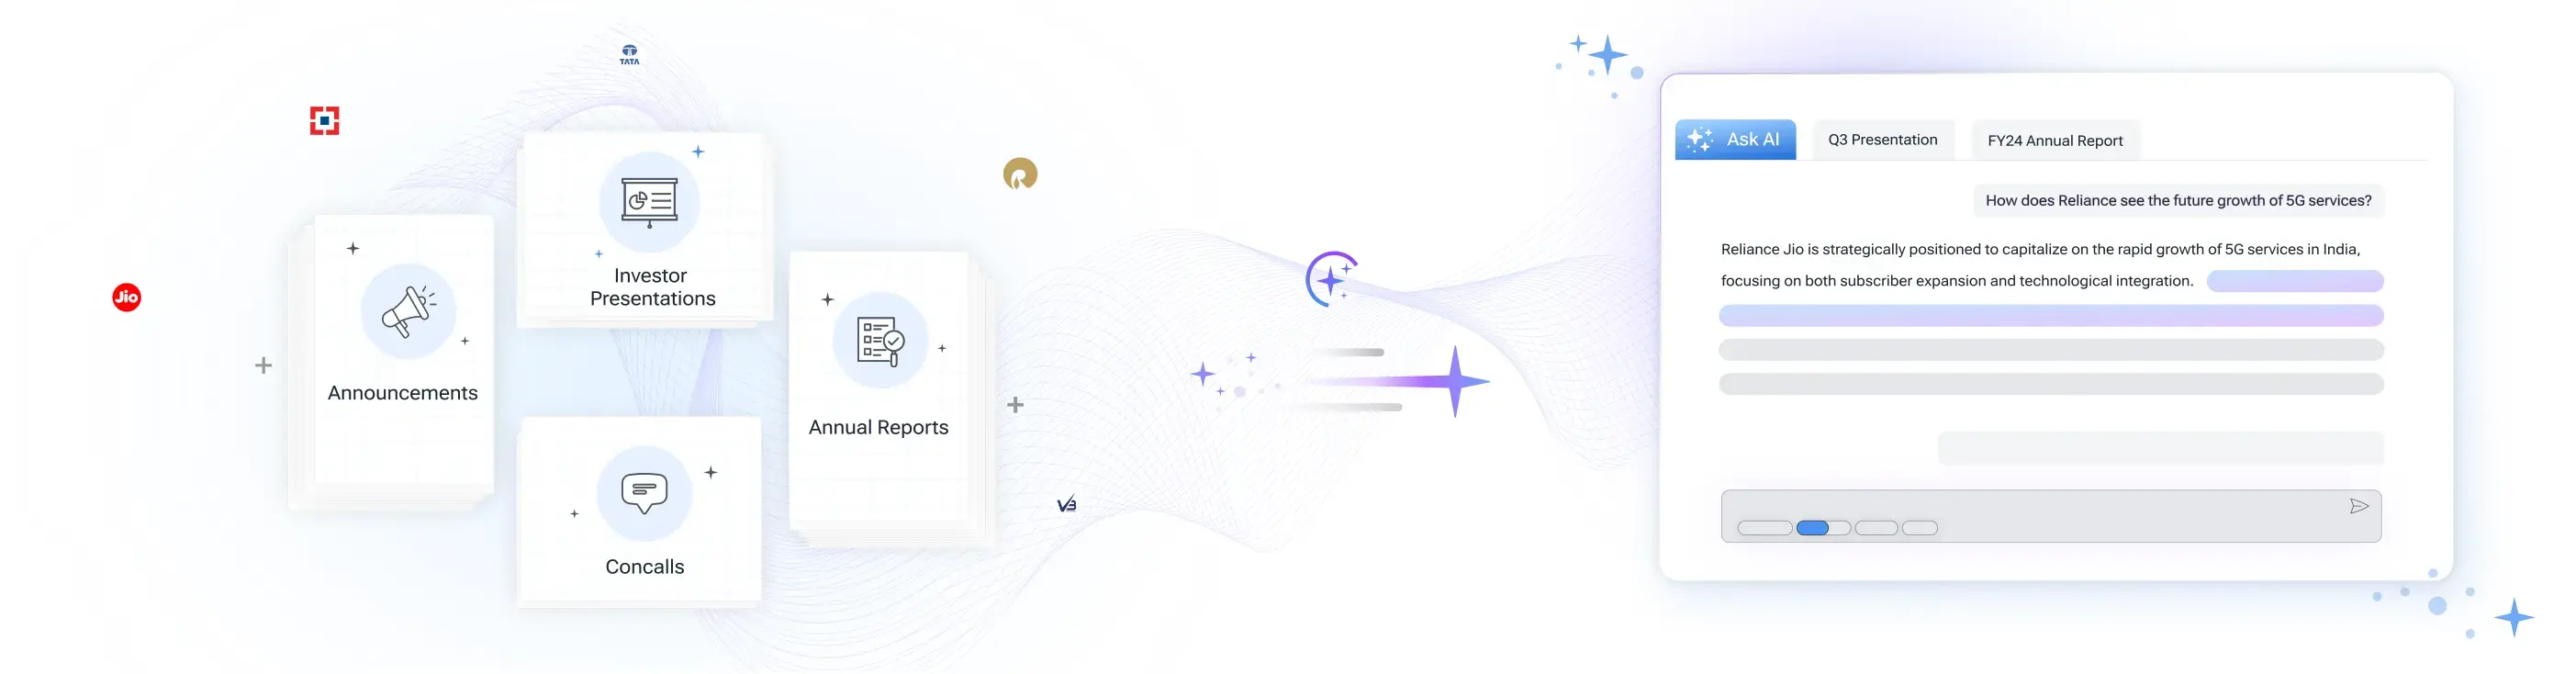
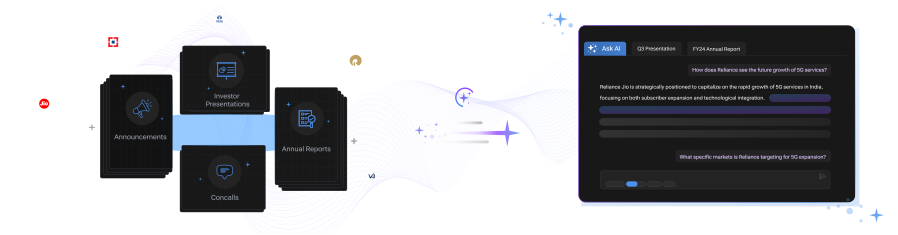
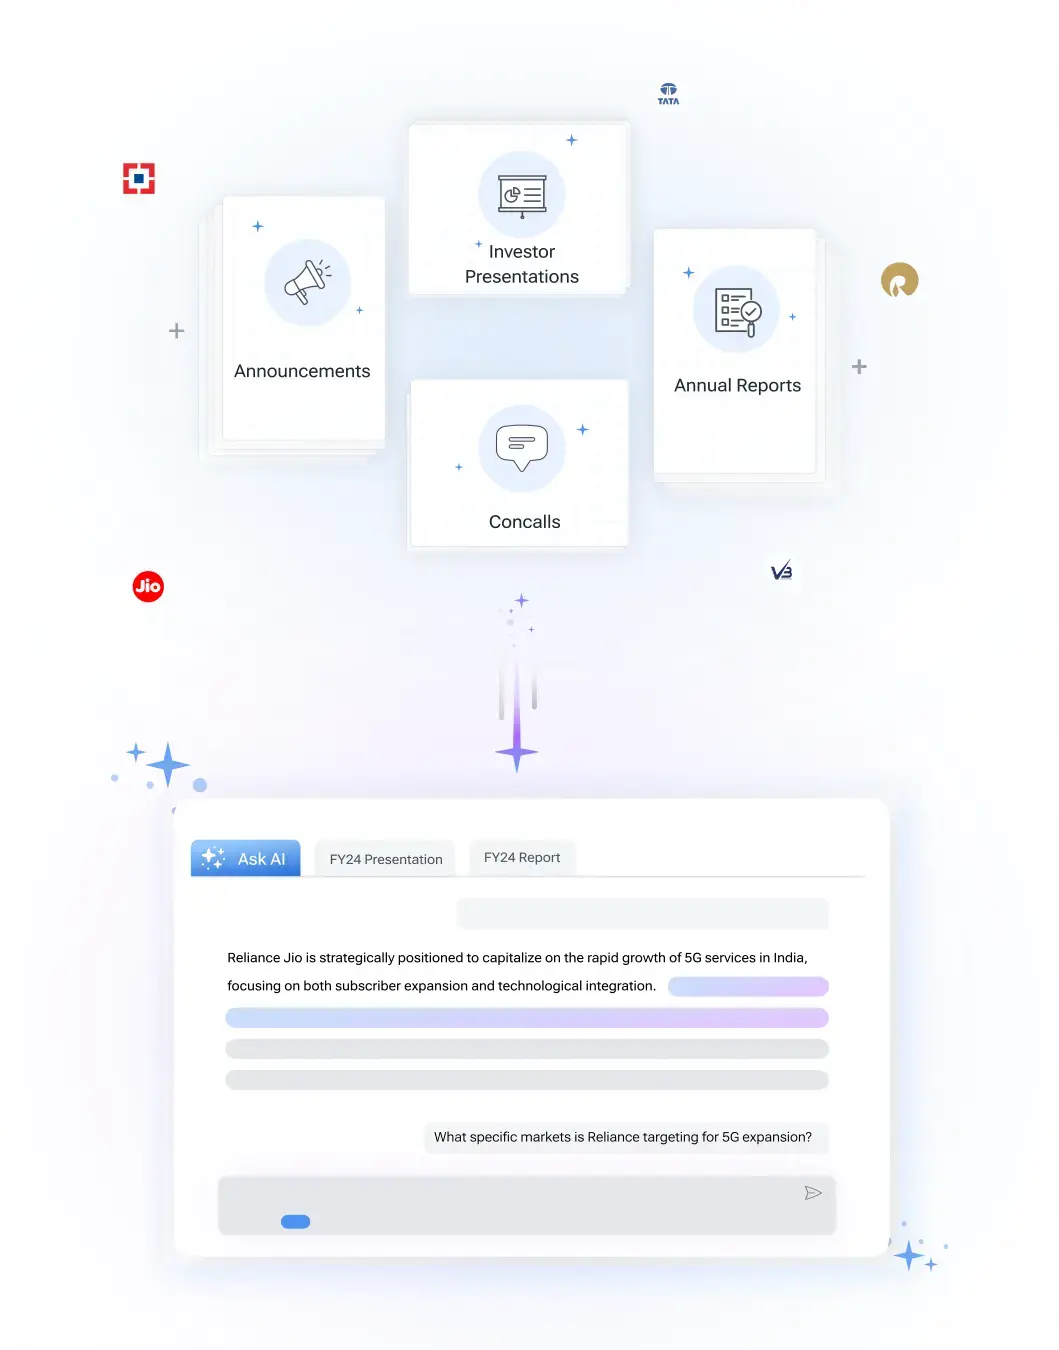
Get instant AI-powered insights about company performance, financials, and strategy. Ask questions about trends, competition, and developments while receiving responses backed by official documents and market data, with clear attribution to source documents.

 Discovery themes featuring this stock
Bearish
3
Neutral
1
Bullish
10
Bearish
30
Neutral
1
Bullish
15
Bearish
27
Neutral
0
Bullish
5
View Standalone
View Standalone
View Standalone
View Standalone
View Standalone
View Standalone
View Standalone
View Standalone




Earnings Call/Transcript
Redington will hold an earnings conference call on November 4, 2026, at 5:30 PM IST to discuss its Q2 FY27 financial results.
Board Meeting
Redington will hold a board meeting on November 4, 2026, to approve unaudited standalone and consolidated results for the quarter and half year ended September 30, 2026.
Redington Ltd (REDINGTON) is currently trading at 326.75 per share. Stock prices fluctuate during market hours on NSE and BSE based on demand, company updates, and overall market conditions. Refer to the live price chart above for the most recent price movement.
Redington Limited is an integrated supply‑chain and technology distributor that sources, sells and services IT, mobility, cloud and software solutions across India, Middle East, Turkey, Africa and South Asia, while operating platforms and subsidiaries for logistics and solutions delivery. Q1 FY27 was an exceptional quarter: consolidated revenue reached INR34,966 crores (+34% YoY), EBITDA INR751 crores (+67% YoY) and PAT INR486 crores (+77% YoY), with excluding‑Arena results showing even stronger profitability and operating leverage, signalling scale and margin expansion. Cloud and data centre momentum is accelerating materially for Redington Limited: management disclosed nearly INR1,000 crores of large data centre deal revenue in the quarter, a backlog many multiples of that amount, and active engagement with neocloud operators and hyperscalers. Redington Limited is commercializing AI and platform capabilities via CloudQuarks, TrackMyCloud, a Reonics renewal automation tool and an AI exchange marketplace hosting 250+ agents, and earned Microsoft Frontier Partner recognition — moves that shift the company toward higher recurring software and services revenue. Operationally, working capital improved to 32 days and ROCE stood at 22%, but legacy Arena losses (INR64 crores in Q1) and regional geopolitical supply challenges remain key execution risks while management focuses on restructuring and selective strategic choices.
Over the past 52 weeks, Redington Ltd has traded between a low of ₹191.25 and a high of ₹419.55. The 52-week high and low indicate the stock’s price range over the last year and help investors understand its volatility and recent trading levels.
Redington Ltd has a market capitalization of approximately 27,905.44. Market capitalization represents the total value of a company’s outstanding shares and helps investors understand its size, stability, and relative risk compared to other listed companies.
Redington Ltd’s investment profile depends on its business fundamentals, valuation, and long-term outlook. The stock currently trades at a PE ratio of 18.55 and operates in the its sector sector. Investors typically assess financial performance, growth prospects, and individual risk tolerance before making investment decisions.
Based on its market capitalization of 27,905.44 Cr, Redington Ltd is classified as a Small Cap stock. Large-cap stocks are generally more stable, while mid-cap and small-cap stocks tend to offer higher growth potential along with higher price volatility.
Redington Ltd operates in the its sector sector. Sector classification matters because companies in the same sector are often affected by similar economic conditions, regulatory changes, and competitive dynamics, which can influence overall stock performance.
The Price-to-Earnings (PE) ratio of Redington Ltd is 18.55. The PE ratio compares a company’s share price to its earnings and is commonly used to assess valuation. Comparing the PE ratio with sector peers and historical levels provides better context.
Revenue was ₹3,492.2b and consolidated net profit was ₹48.6b for Q1 FY27.
Redington is focusing on Global Capability Centres (around 1,800 in India), AI-led infrastructure, data centres, and services-led engagements as it shifts beyond pure-play distribution.
Management cited Q4 FY25 revenue of ₹26,510 crore and profit of ₹400 crore, excluding Paynet divestment gains. Other reports cited revenue from operations of ₹26,439.68 crore and net profit of ₹665.62 crore.
In Q3 FY26, Redington reported a 16% year-on-year revenue increase to ₹30,959 crore and a 9% rise in net profit to ₹436 crore, maintaining a PAT margin of 1.41%.
| Symbol | Watchlist | Price | Market Cap | P/E | P/B | Div Yield (%) | ROE (%) | ROCE (%) | ROA (%) |
356.95 | 27,905 Cr | 18.55 | 2.75 | 1.68 | 14.67 | 15.80 | 4.45 | ||
52.11 | 7,817 Cr | 17.47 | 3.69 | 0.00 | 4.72 | 7.79 | 16.00 | ||
570.75 | 4,018 Cr | 17.15 | 4.45 | 2.75 | 24.16 | 27.50 | 11.65 | ||
153.70 | 2,252 Cr | 28.59 | 4.06 | 0.10 | 12.68 | 14.11 | 10.86 | ||
1202.40 | 1,816 Cr | 22.52 | 4.53 | 0.04 | 20.11 | 21.02 | 6.08 | ||
119.20 | 1,165 Cr | 68.27 | 2.50 | 0.00 | 7.36 | 4.20 | 3.25 | ||
12.01 | 1,082 Cr | -8323.38 | 12.03 | 0.00 | -0.05 | 0.02 | -0.12 | ||
| Median: 7 Co. | — | 153.70 | 2,252 Cr | 18.55 | 4.06 | 0.04 | 12.68 | 14.11 | 6.08 |


Redington Limited is an integrated supply‑chain and technology distributor that sources, sells and services IT, mobility, cloud and software solutions across India, Middle East, Turkey, Africa and South Asia, while operating platforms and subsidiaries for logistics and solutions delivery.
Q1 FY27 was an exceptional quarter: consolidated revenue reached INR34,966 crores (+34% YoY), EBITDA INR751 crores (+67% YoY) and PAT INR486 crores (+77% YoY), with excluding‑Arena results showing even stronger profitability and operating leverage, signalling scale and margin expansion.
Cloud and data centre momentum is accelerating materially for Redington Limited: management disclosed nearly INR1,000 crores of large data centre deal revenue in the quarter, a backlog many multiples of that amount, and active engagement with neocloud operators and hyperscalers.
Redington Limited is commercializing AI and platform capabilities via CloudQuarks, TrackMyCloud, a Reonics renewal automation tool and an AI exchange marketplace hosting 250+ agents, and earned Microsoft Frontier Partner recognition — moves that shift the company toward higher recurring software and services revenue.
Operationally, working capital improved to 32 days and ROCE stood at 22%, but legacy Arena losses (INR64 crores in Q1) and regional geopolitical supply challenges remain key execution risks while management focuses on restructuring and selective strategic choices.
Commercial Services & Supplies
Trading & Distributors
25,544 Cr
High Risk
17.0
20.7
1.2
2.8
419.55
191.25
Sales CAGR
Profit CAGR
ROE
ROCE


