Actions
Action Type



Welcome to Multibagg AI
Log in to access personalized features
IRIS
Multibagg AI is an AI powered stock research and analysis platform. We provide data, information, content, and analytics for publicly traded Indian companies listed on NSE and BSE. AI can make mistakes, check important information.
Research powered by GOALZEN CAPITAL SERVICES PRIVATE LIMITED · SEBI Research Analyst INH000013448
Prices might be delayed by a few minutes.
Join our Exclusive Community


Join our Exclusive Community
Made with 💙 in India. © Finsky Technologies Pvt Ltd. 2026


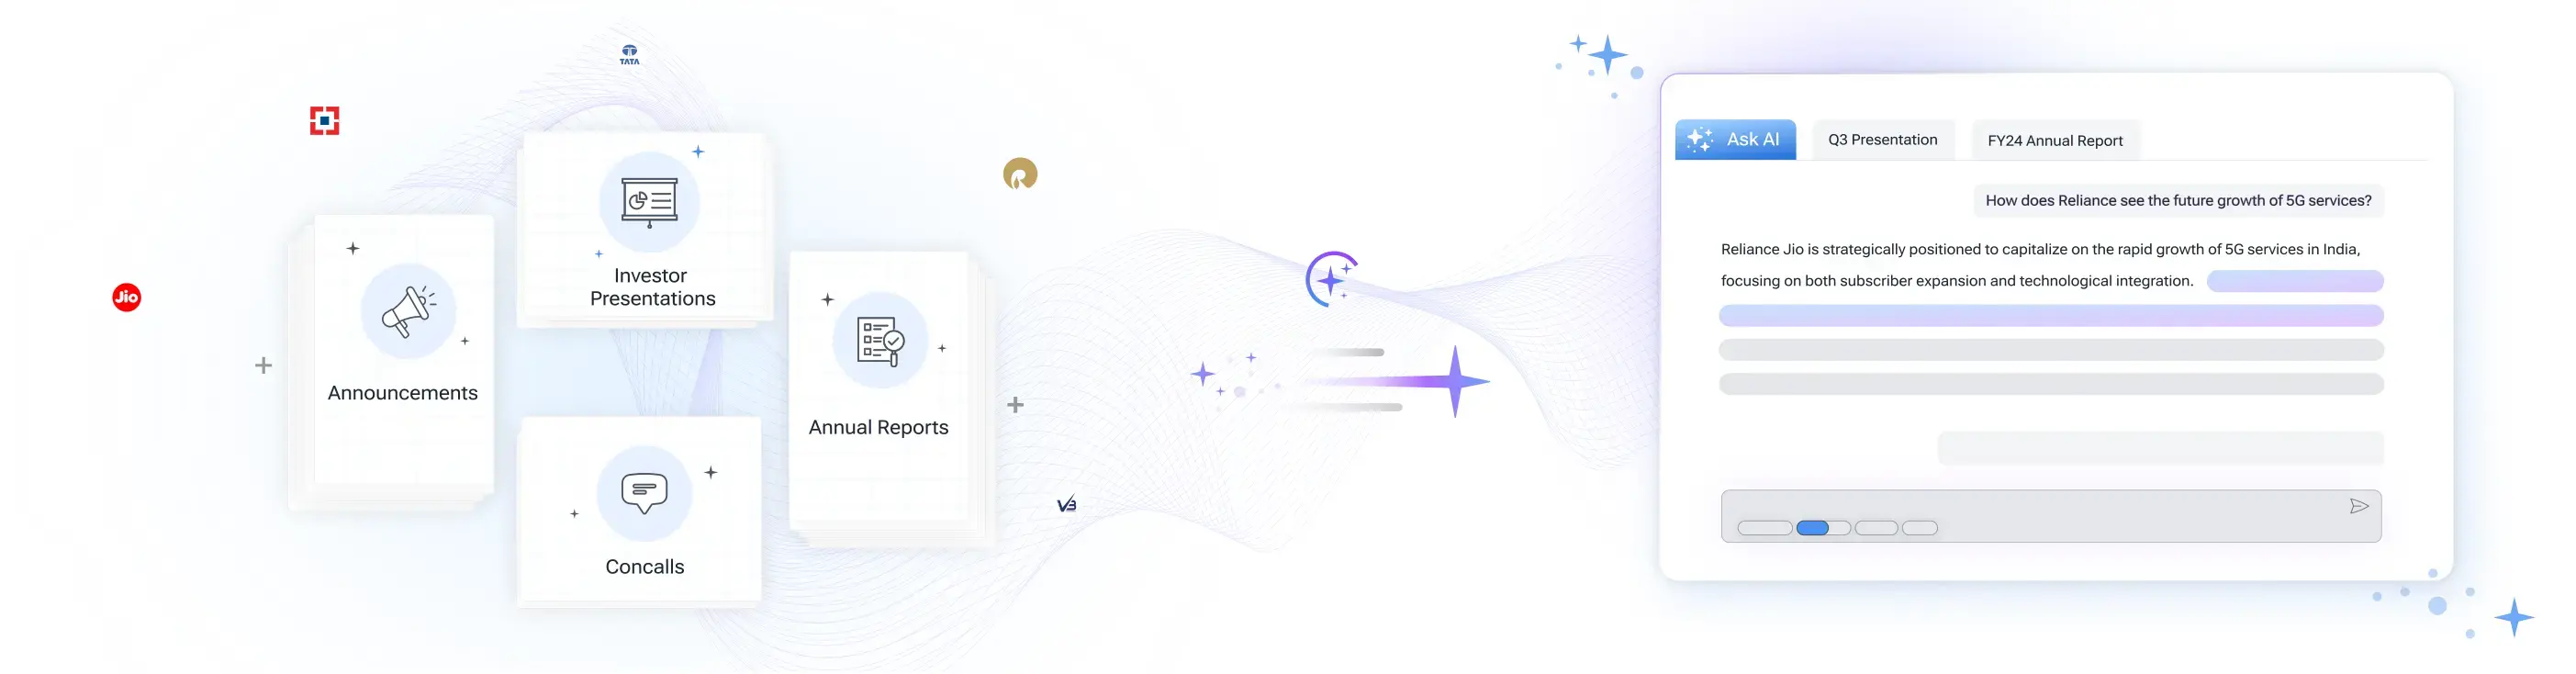
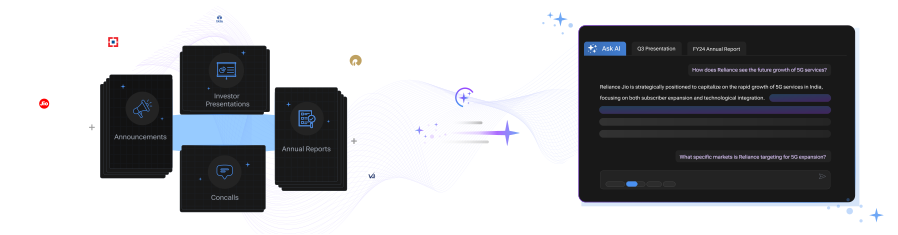
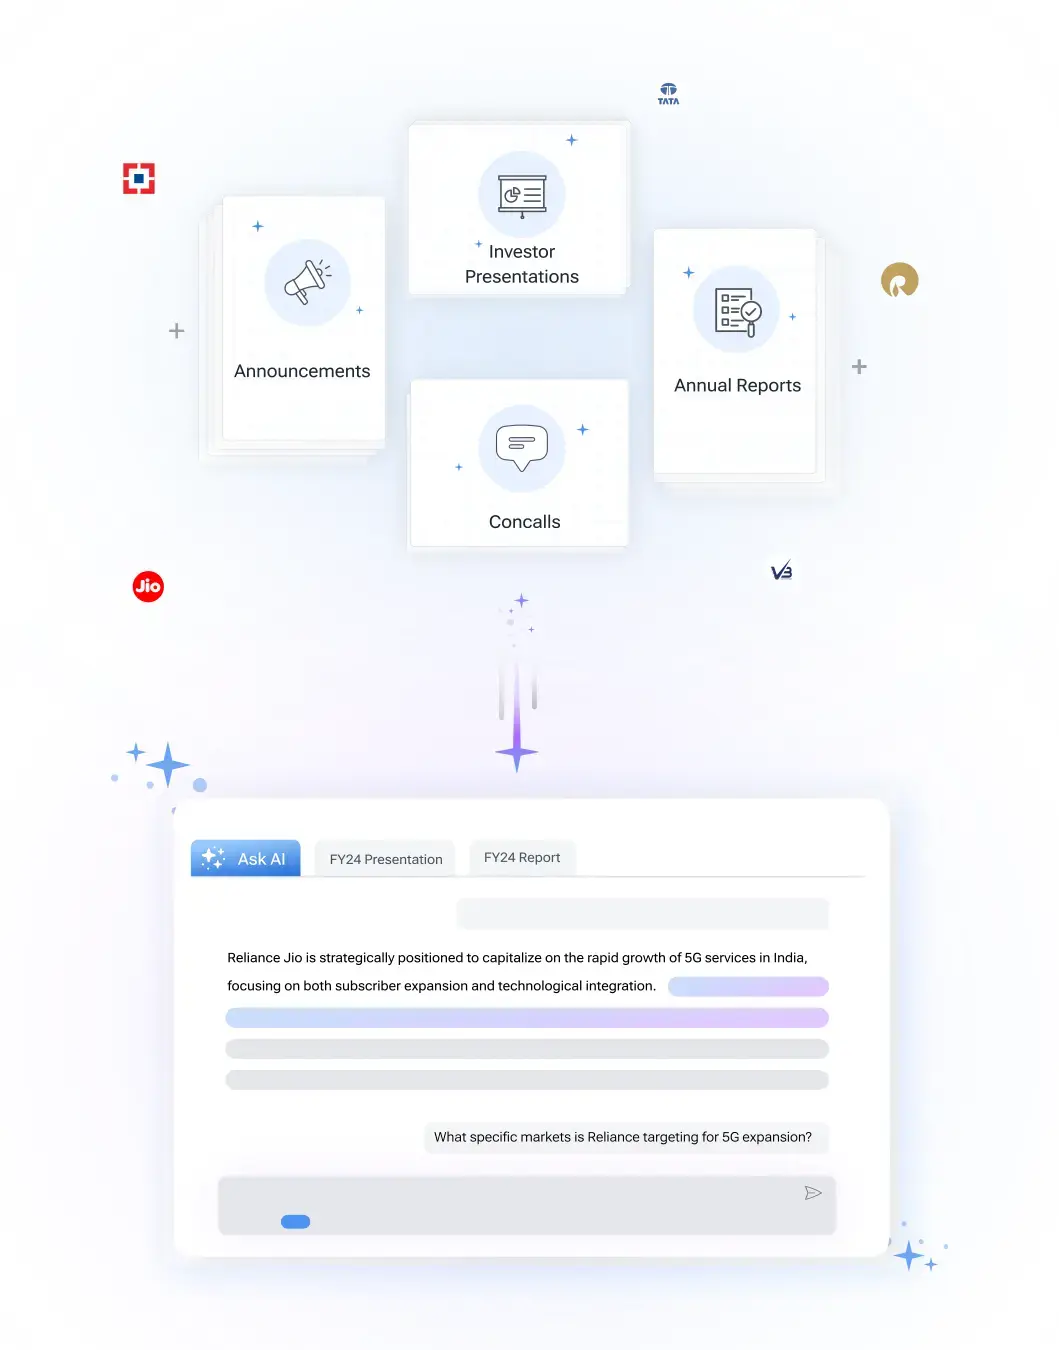
Get instant AI-powered insights about company performance, financials, and strategy. Ask questions about trends, competition, and developments while receiving responses backed by official documents and market data, with clear attribution to source documents.

 Discovery themes featuring this stock
Bearish
4
Neutral
5
Bullish
5
Bearish
23
Neutral
5
Bullish
18
Bearish
19
Neutral
0
Bullish
13
Bearish
4
Neutral
5
Bullish
5
Bearish
4
Neutral
5
Bullish
5
Bearish
19
Neutral
0
Bullish
13
Bearish
19
Neutral
0
Bullish
13
Bearish
19
Neutral
0
Bullish
13
View Standalone
View Standalone
View Standalone
View Standalone
View Standalone
View Standalone
View Standalone
View Standalone


 Discovery themes featuring this stock
Shree Pushkar Chemicals & Fertilizers Ltd (SHREEPUSHK) is currently trading at 480.30 per share. Stock prices fluctuate during market hours on NSE and BSE based on demand, company updates, and overall market conditions. Refer to the live price chart above for the most recent price movement.
Shree Pushkar Chemicals & Fertilisers Limited is an integrated Indian manufacturer of fertilizers, dyes and dye intermediates, soil conditioners and related chemical products, operating state‑of‑the‑art facilities at Lote Parshuram and other sites and producing large volumes of K‑Acid, SOP, reactive dyes and NPK/SSP fertilizers for domestic and export markets. Q1 FY27 showed resilient results with revenue of about Rs. 281 crore (up ~10% YoY) despite lower physical volumes, driven by improved realizations; EBITDA rose near 9.7% to approximately Rs. 31–32 crore with an EBITDA margin of 11.4% and PAT of Rs. 22.9 crore (8.2% margin), reflecting disciplined cost control. Operational volumes were down in Q1 (fertilizer 66,527 MT vs 76,288 MT prior year; chemicals 9,113 MT vs 14,837 MT) but management achieved better pricing and deliberately held inventory during price rallies, indicating a value‑over‑volume commercial stance to protect margins during market volatility. The company is executing a sizeable capex programme (cumulative Rs. 209 crore spent of a planned Rs. 512 crore) including Ratnagiri Units 5/6 and a large Meghnagar expansion, plus renewable investments (a near‑complete 10 MW DC solar project at Nanded taking total solar capacity to ~20.6 MW DC), signalling a multi‑year scale‑up plan. Liquidity and funding remain comfortable with Rs. 125 crore in non‑lien deposits and a mix of internal accruals plus proceeds from a preferential issue committed to finance the remaining capex, enabling the company to pursue staged commissioning while maintaining balance‑sheet discipline.
Over the past 52 weeks, Shree Pushkar Chemicals & Fertilizers Ltd has traded between a low of ₹273.40 and a high of ₹544.75. The 52-week high and low indicate the stock’s price range over the last year and help investors understand its volatility and recent trading levels.
Shree Pushkar Chemicals & Fertilizers Ltd has a market capitalization of approximately 1,630.47. Market capitalization represents the total value of a company’s outstanding shares and helps investors understand its size, stability, and relative risk compared to other listed companies.
Shree Pushkar Chemicals & Fertilizers Ltd’s investment profile depends on its business fundamentals, valuation, and long-term outlook. The stock currently trades at a PE ratio of 22.62 and operates in the its sector sector. Investors typically assess financial performance, growth prospects, and individual risk tolerance before making investment decisions.
Based on its market capitalization of 1,630.47 Cr, Shree Pushkar Chemicals & Fertilizers Ltd is classified as a Small Cap stock. Large-cap stocks are generally more stable, while mid-cap and small-cap stocks tend to offer higher growth potential along with higher price volatility.
Shree Pushkar Chemicals & Fertilizers Ltd operates in the its sector sector. Sector classification matters because companies in the same sector are often affected by similar economic conditions, regulatory changes, and competitive dynamics, which can influence overall stock performance.
The Price-to-Earnings (PE) ratio of Shree Pushkar Chemicals & Fertilizers Ltd is 22.62. The PE ratio compares a company’s share price to its earnings and is commonly used to assess valuation. Comparing the PE ratio with sector peers and historical levels provides better context.
Revenue from operations was reported at ₹280.10 crore in Q1 FY27, a 10% year-on-year increase; the call remarks also referenced ₹281.1 crore.
The company has scheduled the Q1 FY27 analyst and investor earnings conference call for August 13, 2026, at 4:00 PM IST.
Standalone net sales were Rs 146.57 crore and standalone net profit was Rs 11.31 crore for the March 2026 quarter.


Shree Pushkar Chemicals & Fertilisers Limited is an integrated Indian manufacturer of fertilizers, dyes and dye intermediates, soil conditioners and related chemical products, operating state‑of‑the‑art facilities at Lote Parshuram and other sites and producing large volumes of K‑Acid, SOP, reactive dyes and NPK/SSP fertilizers for domestic and export markets.
Q1 FY27 showed resilient results with revenue of about Rs. 281 crore (up ~10% YoY) despite lower physical volumes, driven by improved realizations; EBITDA rose near 9.7% to approximately Rs. 31–32 crore with an EBITDA margin of 11.4% and PAT of Rs. 22.9 crore (8.2% margin), reflecting disciplined cost control.
Operational volumes were down in Q1 (fertilizer 66,527 MT vs 76,288 MT prior year; chemicals 9,113 MT vs 14,837 MT) but management achieved better pricing and deliberately held inventory during price rallies, indicating a value‑over‑volume commercial stance to protect margins during market volatility.
The company is executing a sizeable capex programme (cumulative Rs. 209 crore spent of a planned Rs. 512 crore) including Ratnagiri Units 5/6 and a large Meghnagar expansion, plus renewable investments (a near‑complete 10 MW DC solar project at Nanded taking total solar capacity to ~20.6 MW DC), signalling a multi‑year scale‑up plan.
Liquidity and funding remain comfortable with Rs. 125 crore in non‑lien deposits and a mix of internal accruals plus proceeds from a preferential issue committed to finance the remaining capex, enabling the company to pursue staged commissioning while maintaining balance‑sheet discipline.
Chemicals & Petrochemicals
Dyes And Pigments
1,553 Cr
Low Risk
21.5
37.3
0.7
2.7
544.75
273.40
Sales CAGR
Profit CAGR
ROE
ROCE



| Symbol | Watchlist | Price | Market Cap | P/E | P/B | Div Yield (%) | ROE (%) | ROCE (%) | ROA (%) |
163.00 | 2,053 Cr | 29.90 | 1.77 | 0.00 | 4.13 | 6.76 | 2.91 | ||
504.20 | 1,630 Cr | 22.62 | 2.71 | 0.42 | 11.49 | 12.05 | 7.43 | ||
351.80 | 1,535 Cr | 22.74 | 2.59 | 0.71 | 7.72 | 9.06 | 7.85 | ||
388.75 | 1,135 Cr | 12.31 | 1.30 | 1.54 | 9.29 | 11.58 | 8.43 | ||
352.95 | 815 Cr | 17.05 | 1.43 | 0.00 | 7.81 | 10.14 | 5.94 | ||
385.10 | 454 Cr | 13.27 | 1.67 | 0.39 | 6.92 | 9.12 | 5.67 | ||
416.10 | 334 Cr | 14.63 | 1.28 | 0.12 | 9.91 | 8.83 | 5.76 | ||
| Median: 7 Co. | — | 385.10 | 1,135 Cr | 17.05 | 1.67 | 0.39 | 7.81 | 9.12 | 5.94 |