










Avalon Group H1 cash flow was Rs 10 crore as gross debt rose
Key highlights
- Avalon reported Rs 10 crore of net operating cash flow in H1 FY27 after a Rs 100 crore working-capital outflow.
- Gross debt rose to Rs 311 crore at September 2026 from Rs 183 crore at March 2026.
- Inventories increased to Rs 596 crore in H1 FY27 from Rs 463 crore in FY26, while inventory days rose to 101 from 84.
- Q2 FY27 EBITDA rose 71.0% year on year to Rs 66 crore and profit after tax rose 59.5% to Rs 40 crore.
powered by IRIS
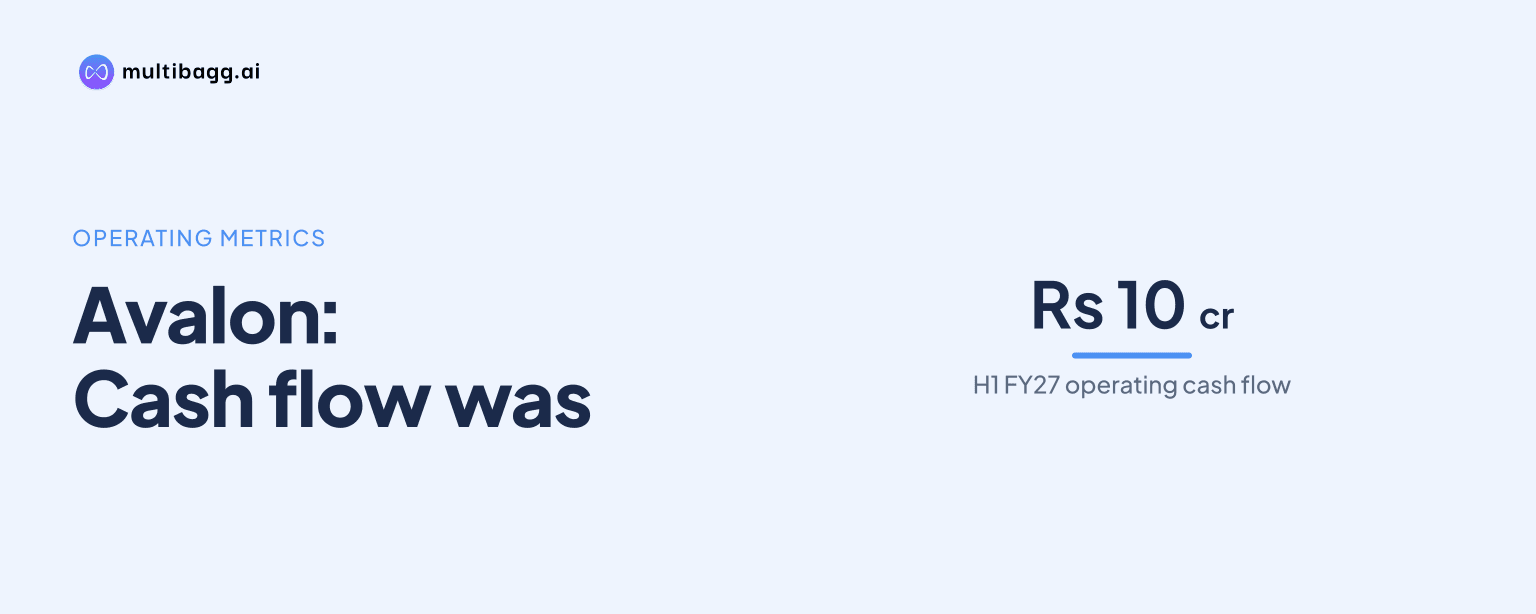
Avalon Group reported Rs 10 crore of net cash from operating activities in H1 FY27 after a Rs 100 crore working-capital outflow reduced Rs 130 crore of operating profit before such changes; gross debt rose to Rs 311 crore at September 2026 from Rs 183 crore at March 2026.
Know Avalon Technologies inside out
Results, valuation, peers and who's buying, in one view.
Why was Avalon’s H1 FY27 operating cash flow Rs 10 crore?
Avalon generated Rs 10 crore of H1 FY27 operating cash flow because working-capital changes absorbed Rs 100 crore and direct taxes paid consumed a further Rs 20 crore. Operating profit before working-capital changes was Rs 130 crore, while cash generated from operations was Rs 29 crore after the working-capital movement. The cash-flow statement then reported Rs 10 crore of net cash from operating activities after tax.
The comparison with FY26 shows that cash conversion remained affected by working capital, although H1 FY27 covers six months and FY26 is a full year. FY26 recorded Rs 196 crore of operating profit before working-capital changes, a Rs 105 crore working-capital outflow, Rs 91 crore of cash generated from operations and Rs 57 crore of net operating cash flow. Avalon’s H1 FY27 working-capital outflow was therefore close to the FY26 full-year outflow in absolute terms.
How did Avalon’s working capital and balance-sheet items change?
Avalon’s inventory balance rose to Rs 596 crore in H1 FY27 from Rs 463 crore in FY26, an increase of Rs 133 crore. Trade receivables increased by Rs 41 crore to Rs 422 crore, while trade payables increased by Rs 83 crore to Rs 334 crore. These balance-sheet movements coincided with the Rs 100 crore outflow classified as changes in working capital in H1 FY27.
Inventory days rose to 101 at September 2026 from 84 at March 2026, reversing part of the improvement from 118 days at March 2024. Trade receivable days increased by one day to 73, while trade payable days increased by nine days to 54. Net working-capital days rose to 120 from 112 at March 2026, although they remained below 161 days at March 2024. Avalon calculates these days on revenue annualised using trailing three-month revenue, adjusted for vendor advances and customer advances.
The working-capital build occurred alongside higher quarterly revenue. Revenue was Rs 525 crore in Q2 FY27, up 37.4% from Rs 382 crore in Q2 FY26 and 8.5% from Rs 484 crore in Q1 FY27. Cost of goods sold rose 37.8% year on year to Rs 346 crore, while gross margin reached Rs 179 crore. The presentation does not separately link the inventory increase to a customer, product or industry segment.
Got a follow-up? Ask IRIS
How much did Avalon’s debt and financing cash flow increase?
Avalon’s gross debt increased by Rs 128 crore to Rs 311 crore at September 2026 from Rs 183 crore at March 2026. The H1 FY27 balance sheet lists Rs 303 crore of current borrowings and Rs 8 crore of non-current borrowings. At FY26, current borrowings were Rs 172 crore and non-current borrowings were Rs 11 crore, together matching the reported Rs 183 crore gross debt.
Net cash from financing activities was Rs 113 crore in H1 FY27, compared with Rs 8 crore in FY26. This financing inflow, alongside Rs 10 crore of operating cash flow and a Rs 59 crore net investing outflow, produced a Rs 64 crore increase in cash and cash equivalents. Closing cash was Rs 135 crore in H1 FY27, compared with Rs 71 crore in FY26.
Avalon reported net debt to earnings before interest, tax, depreciation and amortisation (EBITDA) of 0.5 in H1 FY27, up from 0.2 in FY26 and 0.1 in FY25. The metric was negative 0.3 in FY24, calculated excluding initial public offering cash proceeds. The presentation reports the ratio alongside the higher gross-debt balance but does not disclose a debt-repayment target or timetable.
Did Avalon’s profitability and capital metrics improve despite cash use?
Avalon reported higher Q2 FY27 profitability despite the H1 working-capital cash outflow. EBITDA increased 71.0% year on year to Rs 66 crore from Rs 39 crore, and the EBITDA margin rose to 12.6% from 10.1%. Profit after tax increased 59.5% to Rs 40 crore from Rs 25 crore, while the profit-after-tax margin increased to 7.5% from 6.4%.
Return on capital employed (RoCE) was 24.2% in H1 FY27, compared with 20.6% in FY26, 15.7% in FY25 and 10.0% in FY24. Asset turn rose to 10.7 in H1 FY27 from 9.9 in FY26 and 7.5 in FY25. These reported metrics improved as total assets increased to Rs 1,561 crore from Rs 1,264 crore at FY26, including current assets of Rs 1,248 crore compared with Rs 1,017 crore.
Avalon’s revenue mix also changed. Clean energy represented 29% of H1 FY27 revenue, up from 20% in FY26, while mobility and transportation declined to 25% from 28% and communication fell to 4% from 8%. Industrials remained 34% in both periods. Management’s strategy includes collaborating with established businesses, partnering with emerging clean-energy technology companies, and pursuing profitable segments such as aerospace and complex box-build products.
Conclusion
Avalon’s H1 FY27 results show that reported profitability and operating cash generation moved differently: Rs 130 crore of operating profit before working-capital changes became Rs 10 crore of net operating cash after a Rs 100 crore working-capital outflow and Rs 20 crore of tax payments. Meanwhile, Q2 FY27 profit after tax reached Rs 40 crore, RoCE was 24.2%, and gross debt rose to Rs 311 crore.
The next disclosures should show whether inventory days, which rose to 101 at September 2026 from 84 at March 2026, and net working-capital days, which rose to 120 from 112, change as management pursues India manufacturing, US onboarding and clean-energy partnerships. Avalon reports manufacturing presence of 73% in India and 27% in the US, but the presentation gives no cash-flow target or debt-repayment timetable.