










Belrise revenue reaches ₹9,509.1 crore as EBITDA margin falls
Key highlights
- Belrise's FY26 revenue from operations was ₹9,509.1 crore, versus ₹6,582.5 crore in FY23.
- Belrise's EBITDA rose to ₹1,153.77 crore in FY26, while EBITDA margin declined to 12.1% from 13.3% in FY23.
- Belrise's FY26 PAT was ₹496.86 crore and PAT margin was 5.2%, compared with ₹313.67 crore and 4.8% in FY23.
- Belrise's net debt-to-equity ratio fell to 0.11 times in March 2026 from 1.01 times in March 2025.
powered by IRIS
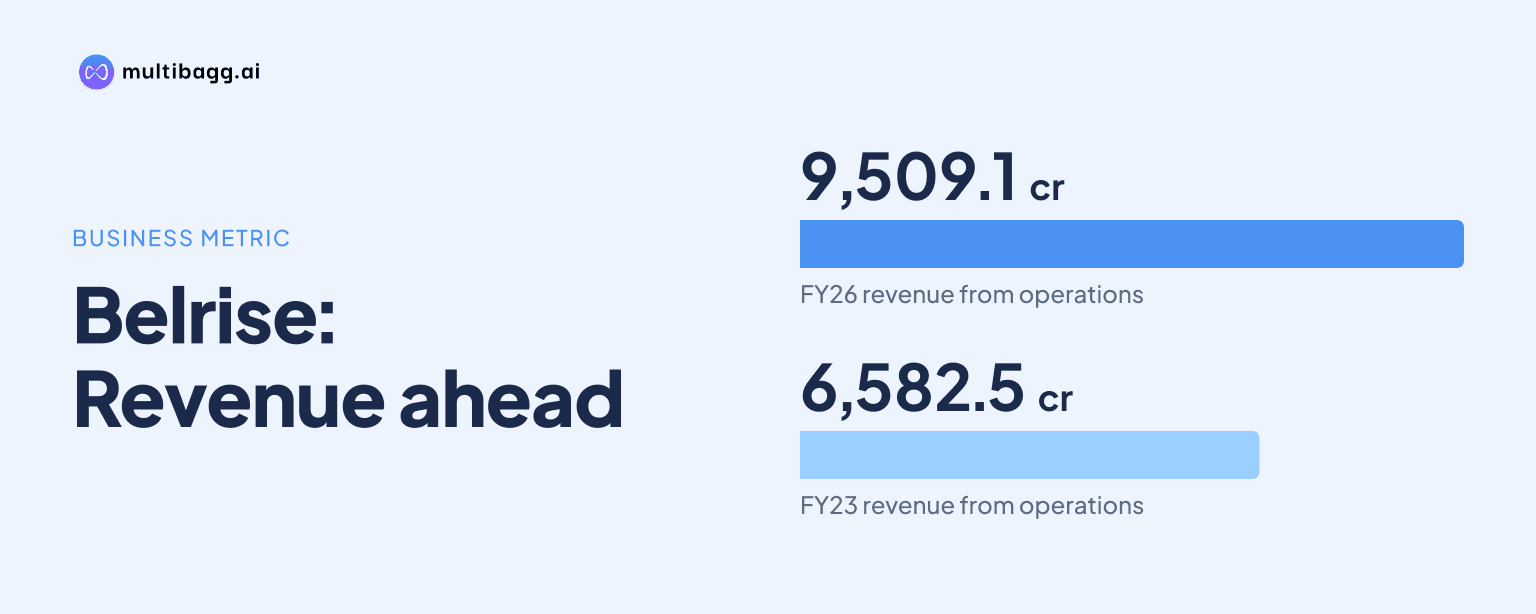
In FY26, Belrise Industries Limited reported revenue from operations of ₹9,509.1 crore, while earnings before interest, tax, depreciation and amortisation (EBITDA) margin declined to 12.1% from 13.3% in FY23. Revenue increased by ₹2,926.6 crore over the four-year period, and profit after tax (PAT) reached ₹496.86 crore in FY26.
Know Belrise Industries inside out
Results, valuation, peers and who's buying, in one view.
How fast did Belrise revenue grow through FY26?
Belrise increased total revenue from operations from ₹6,582.5 crore in FY23 to ₹9,509.1 crore in FY26, a rise of ₹2,926.6 crore. The company reported revenue of ₹7,484.2 crore in FY24 and ₹8,290.8 crore in FY25 between those periods. Its historical-performance presentation reports 13% revenue growth across the FY23-to-FY26 record.
Manufacturing remained the larger contributor throughout the period, rising by ₹2,335 crore between FY23 and FY26, compared with a ₹591.6 crore increase in trading revenue. Manufacturing revenue rose ₹1,140.8 crore in FY26 from FY25, whereas trading revenue increased ₹77.5 crore. The FY26 expansion was therefore concentrated in manufacturing rather than trading.
The FY26 income statement shows cost of goods sold of ₹7,679.89 crore against revenue of ₹9,509.1 crore, producing gross profit of ₹1,829.22 crore. Gross profit was ₹1,329.43 crore in FY23, increasing by ₹499.79 crore as sales expanded. Gross margin, however, moved from 20.2% in FY23 to 19.2% in FY26, after 19.5% in FY24 and 19% in FY25.
Why did Belrise's EBITDA margin decline?
Belrise's EBITDA margin decreased by 1.2 percentage points from 13.3% in FY23 to 12.1% in FY26, even as EBITDA increased from ₹875.49 crore to ₹1,153.77 crore. The margin declined in each reported year, standing at 12.4% in FY24 and 12.3% in FY25. The presentation reports 10% EBITDA growth across the FY23-to-FY26 record.
The margin movement occurred alongside the decline in gross margin from 20.2% to 19.2%. In FY26, employee cost was ₹340.53 crore and other expenses were ₹334.92 crore, compared with ₹235.86 crore and ₹218.07 crore, respectively, in FY23. These costs increased in rupee terms while the reported EBITDA margin narrowed, although the presentation does not provide a specific causal breakdown for the margin decline.
Operating profit before interest and taxes, or EBIT, reached ₹902.58 crore in FY26, compared with ₹607.04 crore in FY23. EBIT margin was 9.5% in FY26, above 9.2% in FY23 and 9.1% in both FY24 and FY25. Depreciation increased from ₹306.74 crore in FY23 to ₹360.95 crore in FY26, while EBITDA increased by ₹278.28 crore over the same period.
Got a follow-up? Ask IRIS
What changed in Belrise's profit and cash generation?
Belrise's PAT rose to ₹496.86 crore in FY26 from ₹313.67 crore in FY23, while PAT margin increased to 5.2% from 4.8%. PAT was nearly unchanged at ₹313.81 crore in FY24 before increasing to ₹355.44 crore in FY25. The FY26 result was ₹141.42 crore higher than FY25, and the presentation reports 17% PAT growth across the FY23-to-FY26 period.
Finance cost declined to ₹231.67 crore in FY26 from ₹307.44 crore in FY25 and was ₹18.67 crore below the FY23 amount of ₹250.34 crore. Profit before tax rose to ₹665.77 crore in FY26 from ₹445.58 crore in FY25. FY26 also includes an exceptional expense of ₹5.14 crore related to implementation of India’s New Labour Code, following a remeasurement of gratuity and leave-encashment obligations; the presentation says adjusted FY26 PAT excludes this expense.
Cash PAT, defined in the presentation as PAT plus depreciation, reached ₹857.81 crore in March 2026, up from ₹620.4 crore in March 2023. Net cash from operating activities was ₹875.6 crore in March 2026, compared with ₹789.49 crore in March 2023 and ₹704.4 crore in March 2025. Investing cash flow was an outflow of ₹474.79 crore in March 2026, below the ₹981.14 crore outflow in March 2025, while cash and cash equivalents ended March 2026 at ₹806.01 crore.
How did Belrise's leverage and balance sheet change?
Belrise reported net debt to equity of 0.11 times in March 2026, compared with 1.11 times in March 2023 and 1.01 times in March 2025. The ratio had declined to 0.94 times in March 2024 before increasing in March 2025. Return on average capital employed, or ROACE, was 14.7% in March 2026 versus 14% in March 2023; Belrise defines ROACE as annualised operating profit before interest and taxes divided by average capital employed.
Total equity increased to ₹5,226.28 crore in March 2026 from ₹2,713.19 crore in March 2025 and ₹2,044.51 crore in March 2023. At the same time, non-current borrowings fell to ₹750.18 crore from ₹1,649.36 crore in March 2025, while current borrowings fell to ₹688.91 crore from ₹1,250.31 crore. Total assets reached ₹8,549.79 crore in March 2026, compared with ₹7,225.48 crore in March 2025.
Working-capital balances were higher at March 2026: inventories were ₹919.2 crore, trade receivables were ₹1,753.65 crore and trade payables due to micro and small enterprises were ₹817.55 crore. These compare with ₹769.73 crore, ₹1,591.13 crore and ₹737.06 crore, respectively, at March 2025. Belrise notes that FY25 financials are not directly comparable because they include the impact of acquiring H-One India Private Limited on 28 March 2025.
Conclusion
Belrise recorded growth in manufacturing, trading and total revenue from FY23 through FY26, lifting revenue from operations to ₹9,509.1 crore and EBITDA to ₹1,153.77 crore. The same record shows a different margin trend: gross margin declined by 1 percentage point and EBITDA margin by 1.2 percentage points, while PAT margin increased to 5.2% and net debt to equity fell to 0.11 times.
The next reported periods will need to be assessed with the 28 March 2025 acquisition of H-One India Private Limited in mind, since Belrise says FY25 figures are not directly comparable. Readers can also watch whether the FY26 ₹5.14 crore New Labour Code-related exceptional expense recurs and how inventory, receivables and operating cash flow develop after March 2026.