










Birlasoft Limited Q2 FY27 Revenue Rises 2.1%, Margin Holds at 15.2%
Key highlights
- Birlasoft reported Q2 FY27 revenue of ₹1,416.2 crore, up 2.7% quarter-on-quarter.
- Q2 FY27 EBITDA was ₹215.3 crore and the EBITDA margin was 15.2%.
- Manufacturing revenue grew 5.2% quarter-on-quarter, while BFSI grew 3.6%.
- Q2 FY27 deal signings were $116.1 million in TCV, up 9% year-on-year.
powered by IRIS
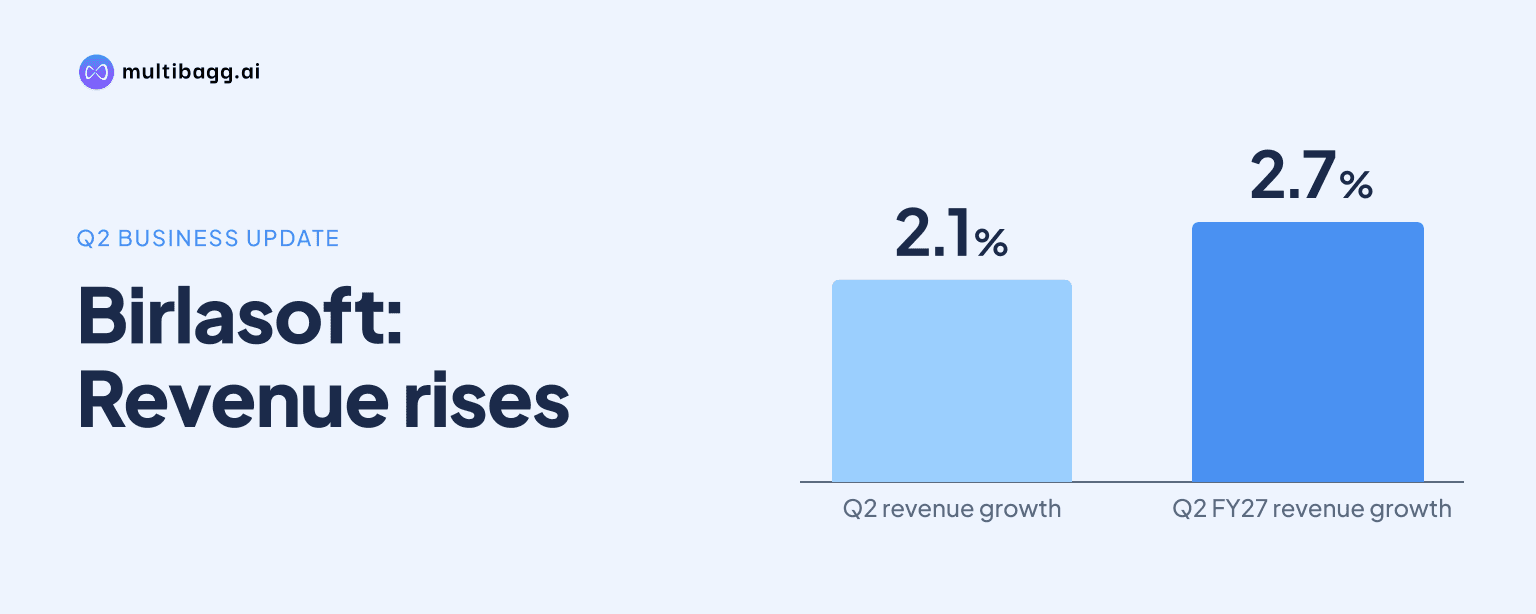
Birlasoft Limited reported 2.1% quarter-on-quarter revenue growth in dollar and constant-currency terms in Q2 FY27, while maintaining a 15.2% EBITDA margin. Revenue reached ₹1,416.2 crore, up 2.7% sequentially, supported by growth in manufacturing, BFSI, life sciences and key service lines.
Know Birlasoft inside out
Results, valuation, peers and who's buying, in one view.
What did Birlasoft report for Q2 FY27?
Birlasoft reported consolidated revenue of $148.3 million for the September 2026 quarter, representing 2.1% quarter-on-quarter growth in both dollar and constant-currency terms. In rupee terms, quarterly revenue stood at ₹1,416.2 crore, a sequential increase of 2.7%.
The company reported EBITDA of ₹215.3 crore, equivalent to $22.5 million, and an EBITDA margin of 15.2%. Profit after tax was ₹159.6 crore, while the effective tax rate for the quarter was 29%. Management said the margin performance remained within the range it had indicated earlier, despite the organisation-wide compensation revision that took effect from July 2026 and continued investments in the business.
Which businesses supported Birlasoft's quarterly growth?
Birlasoft said manufacturing, BFSI, and life sciences and services drove the quarter's growth. Manufacturing revenue increased 5.2% quarter-on-quarter, followed by BFSI at 3.6% and life sciences and services at 2.1%.
Among service lines, Digital and Data grew 3.4% sequentially, while ERP revenue rose 2.9%. Management noted that life sciences and ERP recorded their second consecutive quarter of sequential growth. Manufacturing and BFSI also expanded during the quarter, providing support to the overall revenue performance.
However, the energy and utilities vertical remained soft. The company attributed this to the rundown of work at one client. This disclosure indicates that the quarterly performance was uneven across verticals, even as the broader portfolio posted sequential growth.
What did management say about deal wins and operations?
Birlasoft signed deals with total contract value of $116.1 million during Q2 FY27, up 9% year-on-year. For the first half of FY27, deal signings reached $285 million, representing a 15% year-on-year increase.
Management said the quarter included several AI-led engagements. One disclosed win involved a strategic transformation programme for a leading European logistics organisation, covering large-scale platform modernisation, cloud adoption and business transformation. The company did not disclose the contract value or duration of this engagement.
The reported deal activity is relevant because it shows continued client demand across technology transformation services. At the same time, management indicated that future growth depends on converting its pipeline into stronger deal signings. This makes the pace and quality of new contracts an important operating measure for investors tracking the company through the second half of the year.
Got a follow-up? Ask IRIS
How did Birlasoft's cash position and shareholder returns change?
Birlasoft reported quarterly collections of $164 million, and its days sales outstanding improved to 51 days, which management described as a two-year best. Cash and cash equivalents stood at $300.4 million as of September 30, 2026.
The company also recommended an interim dividend of ₹3 per share. The dividend recommendation and cash balance were disclosed alongside the operational update, while management highlighted improved collections and cash-flow generation during the quarter.
A lower DSO indicates faster collection of receivables relative to outstanding sales. For an IT services company, the reported improvement in collections can support liquidity and working-capital management. The available data does not provide a comparison for the cash balance or DSO with the preceding quarter, but it confirms that the company entered the second half with substantial reported cash and cash equivalents.
Why do Birlasoft's Q2 FY27 numbers matter to investors?
The Q2 results show that Birlasoft delivered sequential revenue growth while maintaining its stated EBITDA margin range after the July 2026 compensation revision. The 15.2% margin was supported by operational efficiencies, productivity improvements and what management described as a better quality of revenue.
The results also provide a view of where demand was strongest. Manufacturing, BFSI, Digital and Data, and ERP all registered sequential expansion, while energy and utilities faced client-specific pressure. The life sciences vertical and ERP service line each extended their growth to a second consecutive quarter.
For investors, the key disclosed measures are revenue conversion, deal signings, margin discipline and cash collection. Q2 signings of $116.1 million and first-half signings of $285 million indicate higher year-on-year contract activity, but management has linked stronger future growth to further conversion of the pipeline. No share-price movement, annual revenue guidance or full-year margin target was disclosed in the provided earnings-call material.
Conclusion
Birlasoft's Q2 FY27 performance combined 2.1% sequential dollar revenue growth with a 15.2% EBITDA margin, ₹159.6 crore of profit after tax and improved collection metrics. Growth was led by manufacturing, BFSI and life sciences and services, while Digital and Data and ERP expanded among service lines. The energy and utilities business remained a weaker area due to a work rundown at one client.
The next area to watch is the company's conversion of its deal pipeline into new signings during the second half of FY27. Management expects the second half to outperform the first half, while noting that the outcome depends on stronger deal signings. Investors can also monitor whether collection momentum, the 51-day DSO level and margin discipline continue alongside ongoing business investments.