










Caplin Point H1 operating cash flow falls 19% to Rs 205 crore
Key highlights
- Caplin Point reported H1 FY27 net operating cash inflow of Rs 205.25 crore, down from Rs 253.74 crore in H1 FY26.
- Inventory absorbed Rs 115.17 crore of cash and trade receivables absorbed Rs 71.17 crore in H1 FY27.
- Caplin Point reported H1 FY27 free cash flow of Rs 70 crore after Rs 135 crore of capital expenditure.
- H1 FY27 profit after tax rose 16.2% to Rs 361.44 crore despite lower operating cash flow.
powered by IRIS
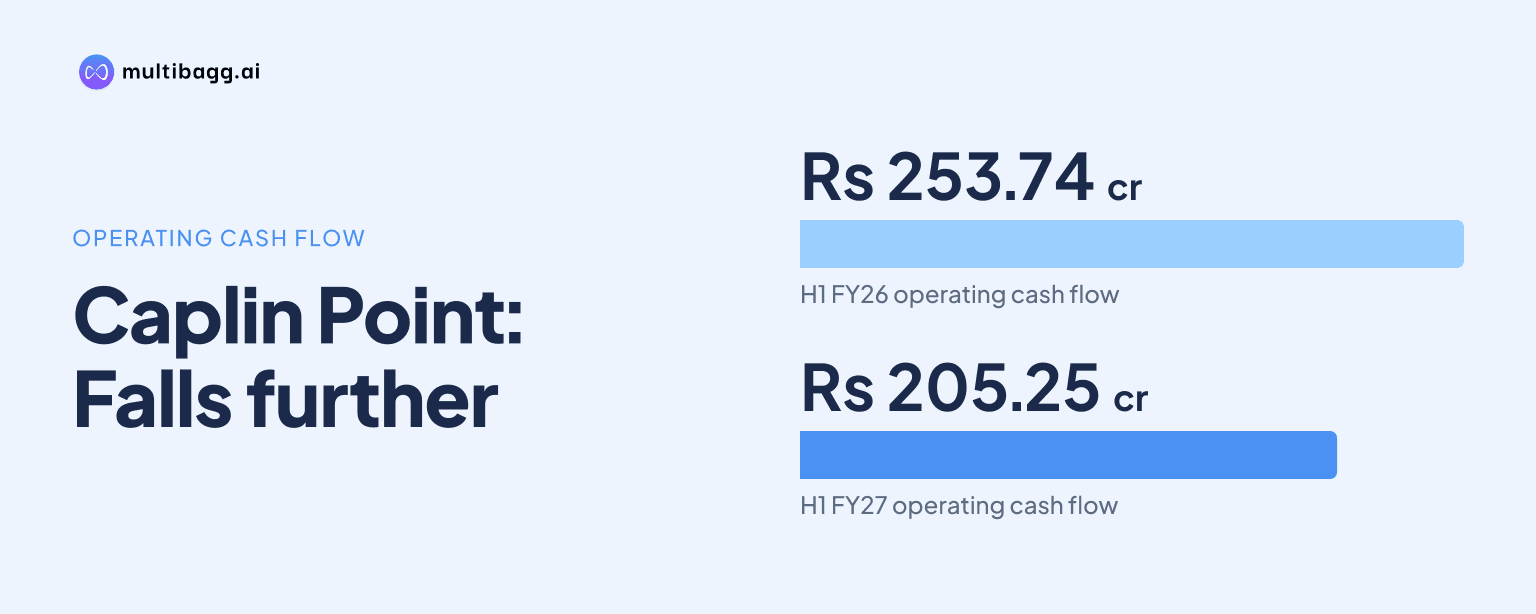
Caplin Point Laboratories Limited reported net operating cash inflow of Rs 205.25 crore in H1 FY27, down 19% from Rs 253.74 crore a year earlier, despite profit after tax rising 16.2% to Rs 361.44 crore. A Rs 115.17 crore inventory build and a Rs 71.17 crore increase in trade receivables absorbed cash during the half year ended September 30, 2026.
Know Caplin Point Laboratories inside out
Results, valuation, peers and who's buying, in one view.
How far did Caplin Point's operating cash flow fall in H1 FY27?
Caplin Point’s net cash inflow from operating activities fell by Rs 48.49 crore to Rs 205.25 crore in H1 FY27, or the first half of financial year 2026-27, from Rs 253.74 crore in H1 FY26. The decline came even as profit before tax increased to Rs 458.05 crore from Rs 385.46 crore and profit after tax rose from Rs 310.99 crore.
Cash generated from operations before tax fell to Rs 285.70 crore from Rs 318.41 crore, a decline of Rs 32.71 crore. Net income tax paid also increased by Rs 15.78 crore to Rs 80.45 crore, which took net operating cash flow below the prior-year level.
Operating profit before working-capital changes increased by Rs 86.40 crore year on year, indicating that the reduction in cash generation followed movements in working capital and taxes. Depreciation and amortisation rose to Rs 45.11 crore from Rs 34.69 crore, while interest income deducted in reaching this measure rose to Rs 45.30 crore from Rs 36.73 crore.
Which working-capital movements used Caplin Point's cash?
Inventory was the largest stated working-capital use of cash, absorbing Rs 115.17 crore in H1 FY27 after releasing Rs 9.94 crore in H1 FY26. The inventory balance reached Rs 544.03 crore on September 30, 2026, compared with Rs 428.86 crore at March 31, 2026.
Trade receivables used Rs 71.17 crore of cash, compared with Rs 55.24 crore in the prior-year half. Receivables stood at Rs 889.39 crore at September 30, 2026, against Rs 825.81 crore six months earlier, and Caplin Point reported a receivables period of 129 days.
Caplin Point said 45% of its Rs 544 crore inventory was held in warehouses close to customers, 18% was in transit and 37% was in India at September 30. These are closing inventory-location measures, while the cash-flow statement records period movements, so they are not a direct reconciliation.
The combined inventory and receivables outflow was Rs 186.34 crore in H1 FY27, versus a Rs 45.30 crore combined cash use from the same two lines in H1 FY26. Other assets consumed Rs 10.60 crore, while trade payables, other liabilities and provisions contributed Rs 48 lakh, following a Rs 28.09 crore outflow a year earlier.
Got a follow-up? Ask IRIS
Why did Caplin Point's free cash flow decline more sharply?
Caplin Point reported free cash flow of Rs 70 crore in H1 FY27, compared with Rs 160 crore in H1 FY26, after capital expenditure of Rs 135 crore against Rs 94 crore. The reported Rs 90 crore reduction reflected both lower operating cash inflow and higher spending on assets.
The statutory cash-flow statement recorded Rs 134.46 crore of payments for property, plant and equipment, including capital work-in-progress, compared with Rs 93.88 crore in H1 FY26. Purchases of investments increased to Rs 105.55 crore from Rs 43.27 crore, although total investing cash outflow narrowed to Rs 152.07 crore from Rs 299.09 crore because other bank balances generated Rs 37.60 crore rather than using Rs 146.86 crore.
Financing activities used Rs 60.99 crore in H1 FY27, compared with Rs 46.01 crore a year earlier, primarily because dividend payments rose to Rs 60.81 crore from Rs 45.61 crore. Cash and cash equivalents were Rs 86.62 crore at September 30, down from Rs 94.18 crore at the beginning of the half year; net cash and cash equivalents were Rs 86.61 crore after deducting Rs 1 lakh in an unspent corporate social responsibility account.
How did Caplin Point's earnings compare with its cash generation?
Caplin Point’s revenue from operations rose 18.8% to Rs 1,240.20 crore in H1 FY27, while total income increased 19.1% to Rs 1,307.04 crore. Earnings before interest, tax, depreciation and amortisation, or EBITDA, increased 19.8% to Rs 503.50 crore, and the EBITDA margin was 38.5%, compared with 38.3% in H1 FY26.
The Rest of the World segment generated Rs 976.19 crore of H1 FY27 revenue, up from Rs 830.61 crore, while USA revenue rose to Rs 264.01 crore from Rs 213.65 crore. Caplin Point described its H1 FY27 geographical revenue mix as about 79% emerging markets, covering Latin America and Africa, and 21% USA, but the growth in revenue did not prevent the higher inventory and receivables from reducing operating cash flow.
At September 30, 2026, Caplin Point reported free cash reserves of Rs 1,534 crore and total liquid assets of Rs 2,967 crore. Current investments were Rs 372.42 crore, compared with Rs 385.71 crore at March 31, while other bank balances were Rs 489.26 crore against Rs 526.86 crore; these balance-sheet amounts are separate from the six-month operating cash-flow measure.
Conclusion
Caplin Point’s H1 FY27 results show reported earnings rising while cash conversion declined. Revenue, EBITDA and profit after tax increased, but inventory and receivables absorbed Rs 186.34 crore of cash, while higher tax payments contributed to the fall in operating cash inflow to Rs 205.25 crore and company-reported free cash flow to Rs 70 crore.
The next disclosed milestones are the working-capital position, including receivables of 129 days, and execution of an approximately Rs 1,000 crore-plus capital-expenditure programme. Caplin Point expects the Puducherry oral solid dosage and dermatology facility to be completed in Q1 FY28, the COL-II injectable facility in Q2 FY28, and its Thervoy oncology active pharmaceutical ingredient plant in calendar year 2027.