










Care reports Rs 392 crore Ind AS profit, Rs 255 crore loss
Key highlights
- Care reported Rs 392 crore of Ind AS profit before tax in H1 FY27, compared with Rs 276 crore in H1 FY26.
- Care's separately presented 1/n tenure-basis income statement reported a Rs 255 crore H1 FY27 pre-tax loss.
- H1 FY27 1/n-basis GWP rose 40.6% to Rs 6,400 crore and retail health GWP increased 50.7% to Rs 4,049 crore.
- Care's tenure-basis combined ratio was 110.9% and its solvency ratio was 1.55 in H1 FY27.
powered by IRIS
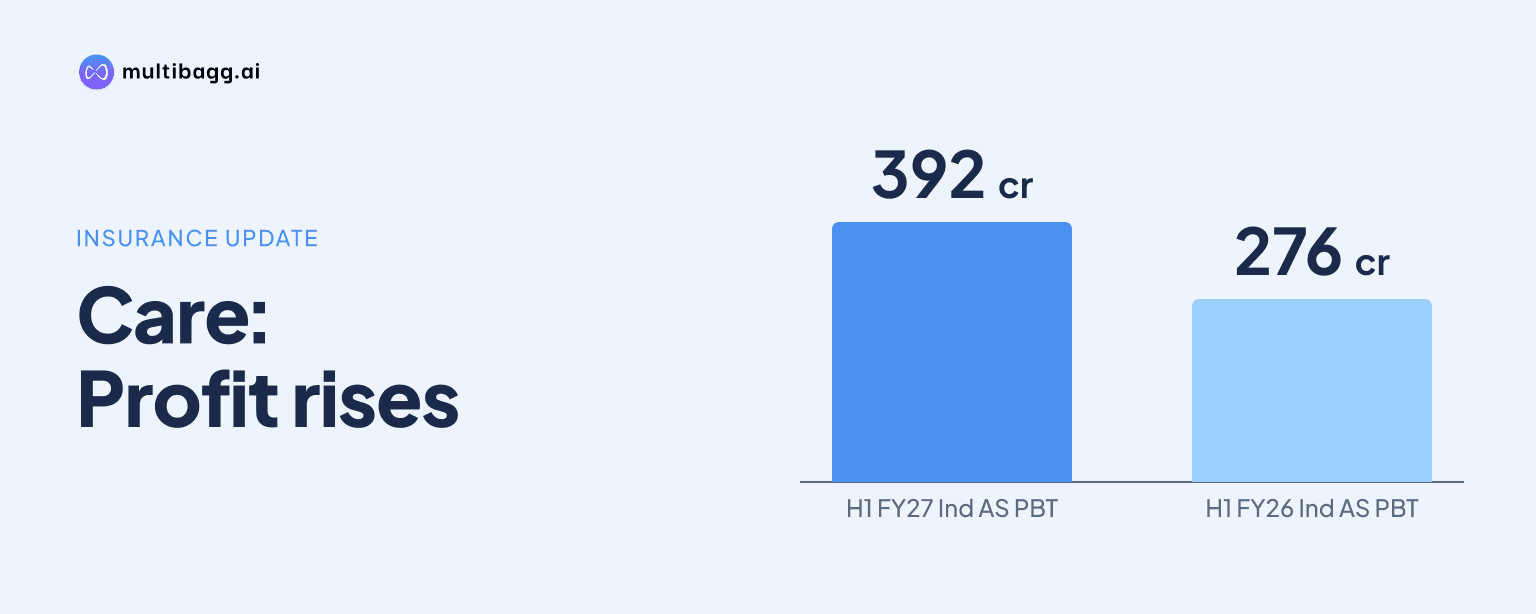
Religare Health Insurance, referred to as Care in its presentation, reported Rs 392 crore of H1 FY27 profit before tax under Indian Accounting Standards (Ind AS), while its separately presented 1/n tenure-basis income statement recorded a Rs 255 crore pre-tax loss. The presentation provides no reconciliation between the two outcomes.
Know Religare Enterprises inside out
Results, valuation, peers and who's buying, in one view.
How did Care's H1 FY27 profit figures differ?
Care reported Rs 392 crore of H1 FY27 pre-tax profit under Ind AS and a Rs 255 crore pre-tax loss in its separately presented 1/n tenure-basis income statement. The Ind AS financial-profile page reported Rs 276 crore of pre-tax profit for H1 FY26, while the tenure-basis statement showed Rs 23 crore of pre-tax profit for the previous half-year.
The difference extended to profit after tax. Care reported Ind AS profit after tax of Rs 293 crore in H1 FY27, compared with Rs 207 crore in H1 FY26. Its tenure-basis statement instead showed a Rs 192 crore loss after tax in H1 FY27, reversing a Rs 18 crore profit after tax in H1 FY26.
Care labels the loss-making statement as being on a “1/n basis (Tenure basis)” and separately labels the profitable financial-profile result as Ind AS. The presentation does not quantify adjustments or timing effects that would bridge the Rs 647 crore difference between the two H1 FY27 pre-tax figures.
What produced Care's Rs 392 crore Ind AS pre-tax profit?
Care's Rs 392 crore Ind AS profit before tax comprised a Rs 129 crore insurance service result and a Rs 408 crore net finance result, less Rs 145 crore of other revenue or expenses, net, under the formula displayed in the presentation. The statement defines profit before tax as the insurance service result plus net finance result minus other revenue or expenses.
Insurance revenue rose to Rs 6,119 crore in H1 FY27 from Rs 4,752 crore in H1 FY26. Incurred claims and expense increased to Rs 4,044 crore from Rs 3,183 crore, amortised insurance cost increased to Rs 1,787 crore from Rs 1,387 crore, and net expenses or income from insurance and reinsurance contracts were Rs 160 crore compared with Rs 135 crore.
These movements resulted in an insurance service result of Rs 129 crore, up from Rs 47 crore. Investment income increased to Rs 437 crore from Rs 331 crore, while insurance finance income or expenses rose to Rs 29 crore from Rs 23 crore, producing a Rs 408 crore net finance result against Rs 308 crore a year earlier.
Care's tax charge was Rs 99 crore in H1 FY27, compared with Rs 69 crore in H1 FY26. The presentation states that Ind AS profit before tax excludes other comprehensive income.
What does Care's tenure-basis income statement show?
Care's 1/n tenure-basis income statement shows pre-tax losses in both H1 FY27 quarters: Rs 131 crore in Q1 FY27 and Rs 124 crore in Q2 FY27. Those two quarterly losses total the Rs 255 crore H1 FY27 pre-tax loss shown in the same statement.
Gross written premium, or GWP, was Rs 3,028 crore in Q1 FY27 and Rs 3,372 crore in Q2 FY27, totalling Rs 6,400 crore for H1 FY27. H1 GWP was Rs 4,551 crore in H1 FY26, while net earned premium rose to Rs 3,991 crore from Rs 3,377 crore.
Investment income in this statement increased to Rs 425 crore in H1 FY27 from Rs 327 crore in H1 FY26. However, the combined ratio rose to 110.9% from 108.6%, as the claims ratio increased to 75.0% from 73.4% and the operating-expense ratio increased to 35.9% from 35.2%.
The ratio mix changed between quarters. Care reported a 110.7% combined ratio in Q1 FY27, comprising a 77.2% claims ratio and 33.5% operating-expense ratio, followed by a 111.1% combined ratio in Q2 FY27, comprising a 72.8% claims ratio and 38.3% operating-expense ratio.
Got a follow-up? Ask IRIS
How did Care's premiums and Ind AS insurance ratios change?
Care's H1 FY27 GWP increased under both presentations on its financial-profile page. On the 1/n basis, GWP rose 40.6% to Rs 6,400 crore from Rs 4,551 crore, while retail health GWP rose 50.7% to Rs 4,049 crore from Rs 2,686 crore.
On the n basis, Care reported GWP of Rs 6,897 crore in H1 FY27, up 35.1% from Rs 5,104 crore. Retail health GWP under that basis was Rs 4,358 crore, up 43.5% from Rs 3,036 crore; the presentation does not explain the calculation difference between its 1/n and n presentations.
Care's Ind AS claims ratio declined to 66.1% in H1 FY27 from 67.0% in H1 FY26, while its expense ratio rose to 34.4% from 34.2%. The combined insurance service ratio was 100.5%, compared with 101.2% a year earlier.
Care also reported a non-annualised return on average equity, measured on profit before tax, of 12.1% for H1 FY27 versus 10.2% for H1 FY26. The corresponding post-tax measure was 9.0%, compared with 7.7%.
What does Care disclose about its reporting presentations?
Care identifies the profitable result as Ind AS and the loss-making statement as a 1/n tenure-basis presentation. The Ind AS statement uses insurance-service and finance-result line items, while the tenure-basis statement reports GWP, net earned premium, investment income, profit and operating ratios.
Care defines its Ind AS combined insurance service ratio as insurance service expenses, net expenses from reinsurance contracts and other operating expenses divided by insurance revenue. This differs from the tenure-basis page, which displays claims and operating-expense ratios, and the presentation does not state that the ratios can be reconciled directly.
Care's tenure-basis net worth was Rs 2,626 crore at H1 FY27, versus Rs 2,671 crore at H1 FY26. Its solvency ratio was 1.55 versus 1.89, assets under management were Rs 12,897 crore versus Rs 9,498 crore, and annualised investment yield was 7.1% versus 7.4%.
Conclusion
Care's H1 FY27 presentation records rapid premium growth and a Rs 392 crore Ind AS pre-tax profit alongside a Rs 255 crore pre-tax loss under the separately presented 1/n tenure basis. The results are not interchangeable because the two presentations use different line-item structures, profit measures and insurance ratios.
The unresolved matter to watch is whether a future Care disclosure provides a numerical reconciliation between its Ind AS and 1/n tenure-basis outcomes. The next reported claims ratios, expense ratios and solvency ratio will also be relevant after the tenure-basis combined ratio reached 110.9% and solvency stood at 1.55 in H1 FY27.