










CESC Limited T&D losses ranged from 6.98% to 35.7% in Q2 FY27
Key highlights
- CESC reported Q2 FY27 T&D losses of 6.98% at Noida Power and 35.7% at Malegaon DF.
- Chandigarh Power reduced T&D loss by 3.99 percentage points to 7.0% in Q2 FY27.
- Malegaon DF's 35.7% T&D loss was 21.8 percentage points above Kota DF's 13.9%.
- CESC's FY26 distribution portfolio served more than 4.9 million customers across 1,454 square kilometres.
powered by IRIS
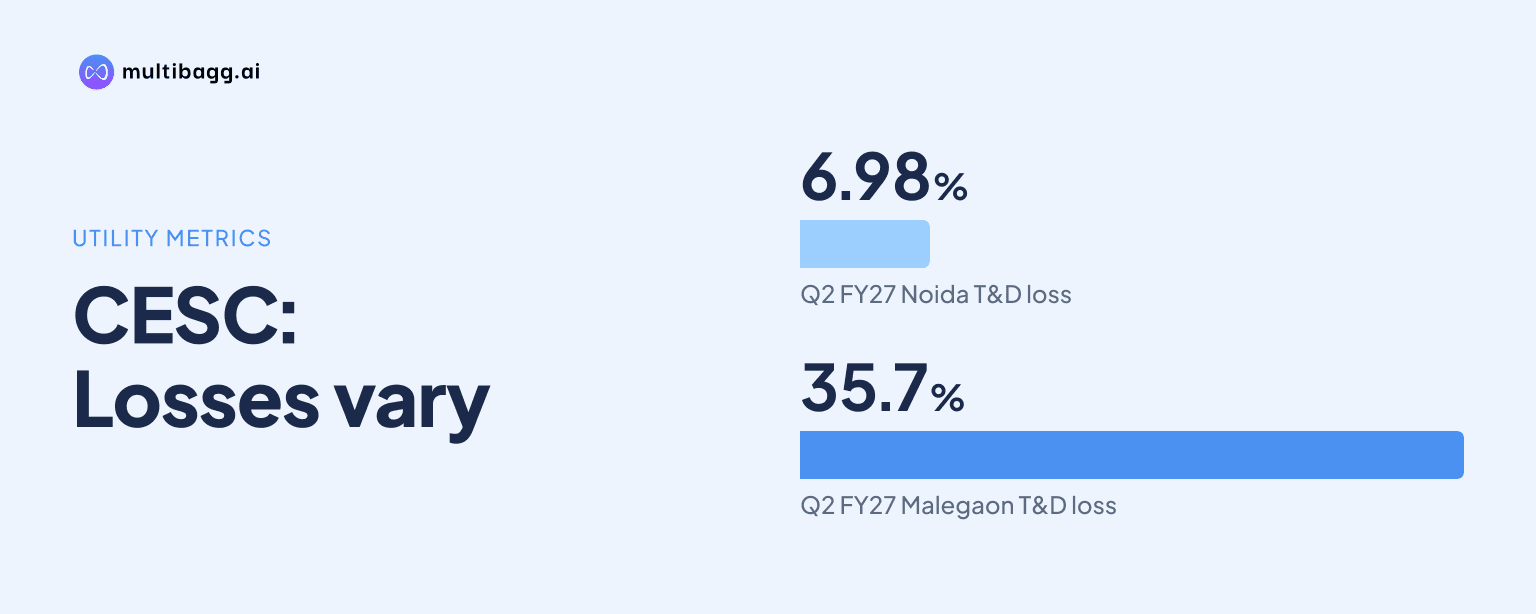
CESC Limited reported Q2 FY27 transmission and distribution, or T&D, losses ranging from 6.98% at Noida Power to 35.7% at Malegaon DF, a 28.72-percentage-point spread. Chandigarh Power reduced its reported rate to 7.0% from 10.99% a year earlier, while Malegaon DF remained the highest-loss disclosed operation.
Know CESC inside out
Results, valuation, peers and who's buying, in one view.
What did CESC's distribution portfolio look like in FY26?
CESC's FY26 distribution portfolio served more than 4.9 million customers, handled more than 4.9 gigawatts of power and covered 1,454 square kilometres across five reported asset areas. It included the Kolkata, Greater Noida and Chandigarh licensees, alongside Rajasthan DF and Malegaon DF, which are identified as input-based franchisees.
Kolkata was the largest reported asset, with 37 lakh consumers, 11,990 million units, or MU, sold and revenue of Rs 9,939 crore in FY26. Malegaon DF had 1.3 lakh consumers, sold 922 MU and recorded revenue of Rs 799 crore. Kolkata's reported FY26 T&D loss was 6.11%, compared with 36.3% at Malegaon DF.
The FY26 Rajasthan DF data are aggregated, while the quarterly table separately reports Kota DF, Bharatpur DF and Bikaner DF. Therefore, the FY26 Rajasthan DF loss rate of 11.44% cannot be directly compared with the Q2 FY27 result of any one of those three operations.
Which CESC networks reduced T&D losses in Q2 FY27?
CESC reported lower year-on-year T&D losses at Noida Power, Chandigarh Power and Malegaon DF in Q2 FY27. Noida Power's rate fell by 1.18 percentage points to 6.98% from 8.16%, Chandigarh Power's declined by 3.99 percentage points to 7.0% from 10.99%, and Malegaon DF's decreased by 1.6 percentage points to 35.7% from 37.3%.
The improvement was not uniform across the disclosed networks. Kota DF's T&D loss increased to 13.9% from 12.8%, while Bikaner DF's increased to 13.1% from 12.5%; Bharatpur DF was unchanged at 9.0%. CESC labels Chandigarh Power's Q2 FY26 loss figure of 10.99% as a moving average.
CESC Kolkata is not included in the quarterly loss-rate comparison because the operational table shows a dash instead of a T&D percentage for both Q2 FY27 and Q2 FY26. Its reported sales include export and banking, whereas the FY26 asset table gives Kolkata a 6.11% T&D loss rate.
Got a follow-up? Ask IRIS
Why was Malegaon DF the T&D loss outlier for CESC?
Malegaon DF was CESC's highest-loss disclosed operation in Q2 FY27 at 35.7%, exceeding the next-highest rate, Kota DF's 13.9%, by 21.8 percentage points. The Malegaon rate was also 28.72 percentage points above Noida Power's 6.98% and 28.7 percentage points above Chandigarh Power's 7.0%.
Malegaon DF's loss rate declined from 37.3% in Q2 FY26 and was 0.6 percentage points below its FY26 asset-level rate of 36.3%. In contrast, FY26 loss rates were 6.95% at Greater Noida, 8.3% at Chandigarh and 11.44% for Rajasthan DF.
A T&D loss percentage is an operating metric rather than a disclosed measure of profit. CESC provides quarterly sales and revenue for Malegaon DF, including 256 MU and Rs 225 crore in Q2 FY27, but does not report distribution operating profit, earnings before interest, tax, depreciation and amortisation, or net profit by asset.
How did CESC's distribution sales and revenue change in Q2 FY27?
CESC's Noida Power and Chandigarh Power increased both sales and revenue while reporting lower T&D losses in Q2 FY27. Noida Power sold 1,285 MU against 1,154 MU in Q2 FY26 and reported revenue of Rs 1,002 crore against Rs 880 crore; Chandigarh Power sold 603 MU against 569 MU and recorded Rs 341 crore against Rs 309 crore.
Malegaon DF also recorded higher sales and revenue despite its 35.7% loss rate. Its sales rose to 256 MU from 240 MU and revenue increased to Rs 225 crore from Rs 208 crore. Kota DF's sales edged down to 368 MU from 370 MU, while its revenue rose to Rs 309 crore from Rs 305 crore and its T&D loss increased to 13.9%.
The three separately reported Rajasthan operations showed mixed volume results. Bharatpur DF sold 102 MU in Q2 FY27, compared with 100 MU a year earlier, while revenue declined to Rs 81 crore from Rs 82 crore. Bikaner DF sold 291 MU compared with 267 MU and reported revenue of Rs 253 crore compared with Rs 237 crore; the presentation does not explain the factors behind these revenue changes.
CESC Kolkata remained the largest quarterly distribution business by disclosed sales and revenue, at 3,468 MU and Rs 2,914 crore in Q2 FY27, against 3,226 MU and Rs 2,729 crore in Q2 FY26. As no quarterly Kolkata T&D loss percentage is reported, its sales increase of 242 MU cannot be assessed against a corresponding quarterly loss-rate movement.
Conclusion
CESC's Q2 FY27 data show materially different operating outcomes across its distribution businesses. Noida Power and Chandigarh Power combined lower T&D losses with higher sales and revenue, while Malegaon DF reduced its loss rate but remained the outlier at 35.7%; Kota DF and Bikaner DF reported higher loss rates than a year earlier.
The next disclosures will show whether Malegaon DF improves below its Q2 FY27 rate of 35.7% and whether Kota DF and Bikaner DF reverse their increases of 1.1 and 0.6 percentage points. CESC does not disclose a distribution-loss target, remedial plan or timetable for these operations in the presentation.