










Chaman Metallics Limited revenue tripled as FY26 loss emerged
Key highlights
- Chaman Metallics Limited reported FY26 revenue from operations of Rs 541.27 crore, versus Rs 172.18 crore in FY25.
- Chaman Metallics reported a FY26 loss after tax and exceptional items of Rs 4.17 crore, after FY25 profit of Rs 9.78 crore.
- Chaman Metallics completed 550 TPD of sponge-iron, 400 TPD of MS-billet, 65 TPD of silico-manganese and 30 MW of captive-power capacity in FY26.
- Management estimated captive power met more than 90% of FY26 needs at Rs 4.06 per unit, against Rs 8.44 per unit for grid power.
powered by IRIS
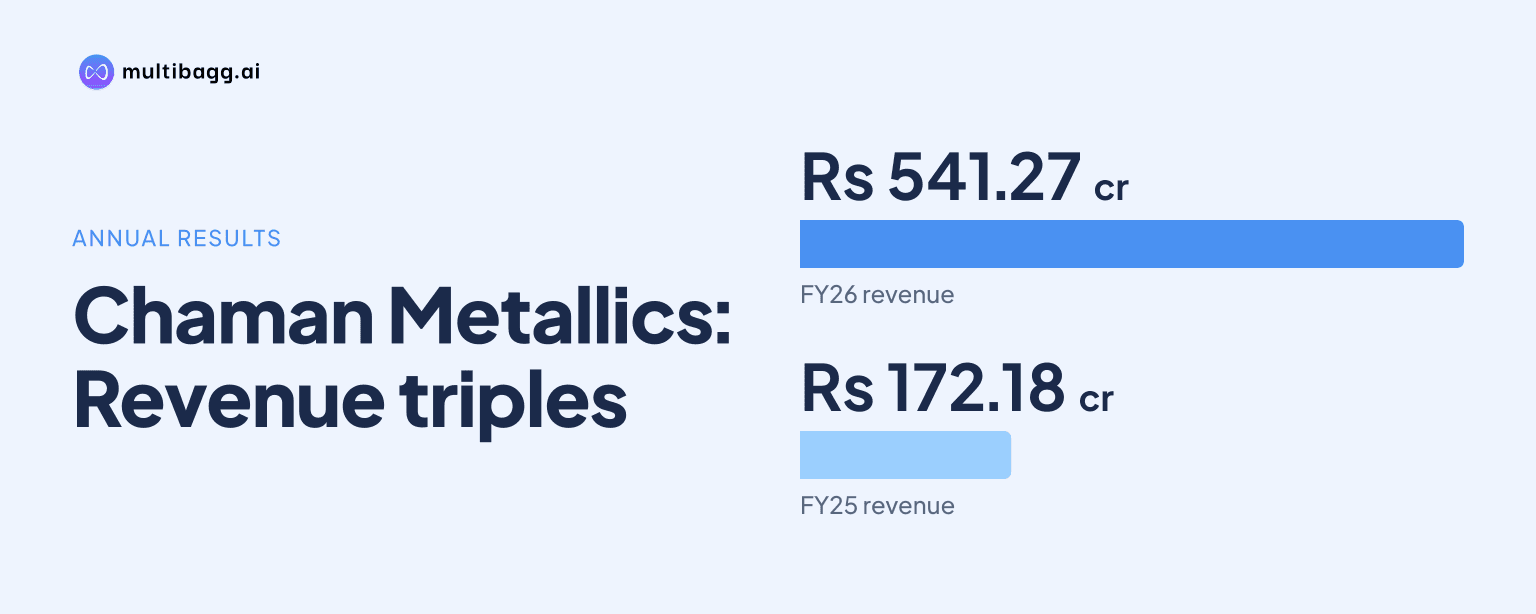
Chaman Metallics Limited reported revenue from operations of Rs 541.27 crore for the year ended March 31, 2026, compared with Rs 172.18 crore in FY25, while profit after tax and exceptional items changed from Rs 9.78 crore to a loss of Rs 4.17 crore during the year it completed its integrated expansion.
Know Chaman Metallics inside out
Results, valuation, peers and who's buying, in one view.
How did Chaman Metallics perform in FY26?
Chaman Metallics generated FY26 revenue from operations of Rs 541.27 crore, or about 3.14 times FY25 revenue of Rs 172.18 crore. Total income increased to Rs 542.28 crore from Rs 174.17 crore in the standalone audited financial statements for the years ended March 31, 2026 and March 31, 2025.
The revenue increase did not result in a reported profit for FY26. Chaman Metallics recorded a loss before tax and exceptional items of Rs 2.80 crore, against a FY25 profit before tax and exceptional items of Rs 13.23 crore. Profit after tax and exceptional items moved to a loss of Rs 4.17 crore from a profit of Rs 9.78 crore.
The financial summary reports the change in revenue and earnings but does not provide an expense-wise reconciliation for the FY26 loss. It does state that Chaman Metallics completed a significant expansion during FY26 and that utilisation of the newly commissioned facilities was being ramped up.
What capacity did Chaman Metallics add in FY26?
Chaman Metallics completed an FY26 expansion that took its operation from a 200 tonnes-per-day, or TPD, sponge-iron facility to an integrated plant with 550 TPD of sponge iron, 400 TPD of mild-steel, or MS, billets, 65 TPD of silico manganese and 30 megawatts, or MW, of captive power capacity. The company said the project enhanced capacity, backward integration and operational efficiency.
The new configuration broadened production beyond direct reduced iron, also called sponge iron. Chaman Metallics manufactures sponge iron, MS billets and ferro alloys in the form of silico manganese, allowing it to operate across multiple stages of the steel manufacturing value chain at its approximately 63-acre Tadali, Chandrapur facility in Maharashtra.
The filing says utilisation of the new facilities was being ramped up, rather than disclosing a final FY26 utilisation rate for any of the 550 TPD sponge-iron, 400 TPD billet or 65 TPD silico-manganese units. This makes FY26 a transition year in which the larger manufacturing base had been commissioned but its capacity use was still developing.
Chaman Metallics identified secondary steel manufacturers as key customers for the expanded product range. Six named customers, including companies based mainly in Jalna, Maharashtra, and one in Vikarabad, Telangana, were among the top 10 customers in FY26 and together contributed 34.51% of revenue from operations. Their products include TMT bars, pipes, plates, coils, dowel bars and other construction-related steel materials.
Got a follow-up? Ask IRIS
How did captive power support Chaman Metallics’ FY26 operations?
Chaman Metallics fully commissioned a 30 MW captive power plant in FY26, comprising a 12 MW waste heat recovery boiler, or WHRB, unit and an 18 MW atmospheric fluidised bed combustion, or AFBC, unit. The WHRB unit uses waste gases from the company’s rotary kilns and requires no additional fuel, according to the filing.
Management estimated that the plant met more than 90% of Chaman Metallics’ power requirement during FY26. It estimated captive-generation cost at Rs 4.06 per unit, compared with Rs 8.44 per unit for grid power, and estimated approximate savings of Rs 52 crore. These figures are management estimates disclosed in the filing rather than a separate audited saving in the standalone financial summary.
The company also stated that surplus electricity from the captive plant can be supplied to the grid. Its 12 MW WHRB unit is intended to use kiln waste gas, while the 18 MW AFBC unit forms the other part of the 30 MW installation, supporting the integrated plant’s power requirements.
The filing does not quantify how the estimated Rs 52 crore of power savings affected FY26 profit after tax and exceptional items, which was a loss of Rs 4.17 crore. It presents the management estimate on captive power separately from the audited financial results, so the reported loss cannot be assigned to a specific cost or operating factor from the supplied disclosure.
What happened to Chaman Metallics’ net worth and per-share measures?
Chaman Metallics’ basic and diluted earnings per share, or EPS, fell to negative Rs 1.73 in FY26 from positive Rs 4.05 in FY25. The filing defines basic EPS as profit attributable to owners divided by the weighted average number of equity shares outstanding, while diluted EPS adjusts that calculation for the effect of dilutive equity shares.
Return on net worth changed to negative 4.28% in FY26 from positive 10.35% in FY25. Chaman Metallics calculates return on net worth as profit or loss after tax divided by average net worth, with average net worth based on opening and closing net worth for the relevant year.
Net worth declined to Rs 95.25 crore at March 31, 2026 from Rs 99.42 crore a year earlier. Reserves and surplus decreased to Rs 71.11 crore from Rs 75.28 crore, while equity share capital was unchanged at Rs 24.13 crore in both FY26 and FY25.
Net asset value per share decreased to Rs 39.46 at March 31, 2026 from Rs 41.19 at March 31, 2025. The company defines this measure as net worth divided by the number of issued, subscribed and fully paid equity shares outstanding at the end of the financial year.
Conclusion
Chaman Metallics paired a substantial increase in FY26 revenue, to Rs 541.27 crore from Rs 172.18 crore, with a reversal from a Rs 9.78 crore FY25 profit to a Rs 4.17 crore FY26 loss. The result coincided with the completion of a project that expanded the business from 200 TPD of sponge iron to an integrated facility including 550 TPD of sponge iron, 400 TPD of MS billets, 65 TPD of silico manganese and 30 MW of captive generation.
The next disclosed operating point to watch is the ramp-up of the newly commissioned facilities, for which Chaman Metallics did not disclose FY26 utilisation percentages. Management’s estimate that captive generation met more than 90% of plant power needs in FY26 at Rs 4.06 per unit, against Rs 8.44 per unit for grid power, is another measure to track as utilisation of the expanded plant develops.