










Dhanuka Agritech Limited Q2 profit rises 16% as sales grow
Key highlights
- Dhanuka’s Q2 FY2026-27 revenue rose 9.91% year on year to Rs 657.51 crore.
- Q2 FY2026-27 PAT increased 16.23% to Rs 109.22 crore, while PAT margin expanded by 90 basis points to 16.61%.
- Insecticides accounted for 47% of Q2 FY2026-27 revenue, while fungicides contributed 25%, Others 20% and herbicides 8%.
- New molecules contributed 12.84% of H1 FY2026-27 revenue, down from 16.14% a year earlier.
powered by IRIS
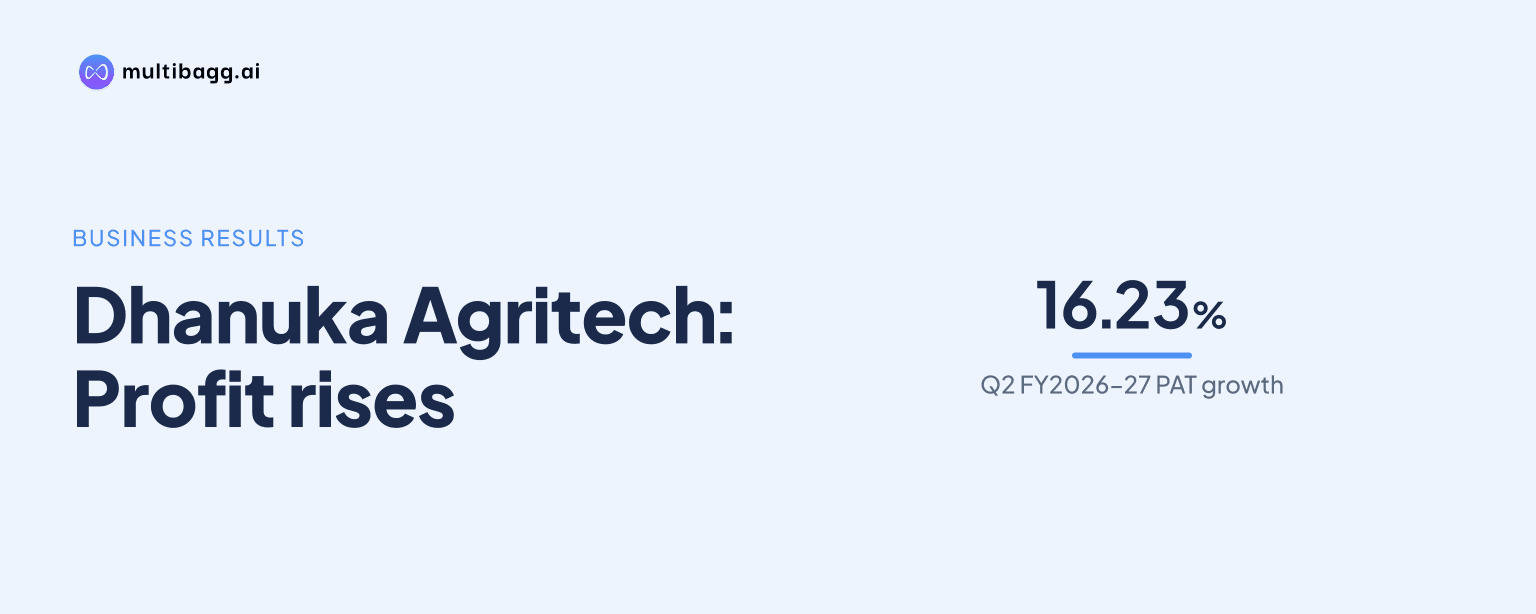
Dhanuka Agritech Limited reported 9.91% year-on-year revenue growth to Rs 657.51 crore and a 16.23% rise in profit after tax to Rs 109.22 crore in the second quarter (Q2) of financial year (FY) 2026-27. Dhanuka’s profit-after-tax margin increased by 90 basis points, but management guided lower-single-digit revenue growth and an approximately 125-basis-point decline in earnings before interest, tax, depreciation and amortisation (EBITDA) margin for FY2026-27.
Know Dhanuka Agritech inside out
Results, valuation, peers and who's buying, in one view.
How did Dhanuka perform in Q2 FY2026-27?
Dhanuka increased revenue, EBITDA and profit after tax in Q2 FY2026-27 compared with Q2 FY2025-26. Revenue from operations rose to Rs 657.51 crore from Rs 598.25 crore, while EBITDA increased to Rs 152.97 crore from Rs 136.73 crore. Profit after tax (PAT) rose to Rs 109.22 crore from Rs 93.97 crore, and basic earnings per share increased 17.12% to Rs 24.43 from Rs 20.85.
The quarter’s operating-margin movement was mixed. Gross profit rose 6.62% to Rs 270.77 crore, but gross margin declined to 41.18% from 42.45% as cost of goods sold rose 12.33% to Rs 386.74 crore. EBITDA grew 11.88%, faster than revenue, while other expenses declined 6.63% to Rs 64.76 crore and employee benefit expenses increased 10.85% to Rs 53.04 crore.
Profit before tax increased 16.27% to Rs 146.47 crore from Rs 125.97 crore in the comparable quarter. Total tax rose 16.41% to Rs 37.25 crore from Rs 32 crore, while other income increased 45.09% to Rs 9.17 crore from Rs 6.32 crore. These income-statement movements accompanied the Rs 15.25 crore increase in quarterly PAT.
What drove Dhanuka’s higher quarterly profit margin?
The presentation does not attribute Dhanuka’s higher margin to a single driver, but EBITDA margin rose to 23.27% in Q2 FY2026-27 from 22.85% a year earlier and PAT margin increased to 16.61% from 15.71%. EBITDA increased by Rs 16.24 crore, compared with a Rs 59.26 crore increase in revenue. Earnings before interest and tax (EBIT) rose 14.60% to Rs 138.06 crore, and EBIT margin increased to 21.00% from 20.14%.
Dhanuka also reported lower depreciation and amortisation expenses and finance costs in the quarter. Depreciation and amortisation expenses declined 8.30% to Rs 14.91 crore from Rs 16.26 crore, while finance cost fell 7.32% to Rs 76 lakh from Rs 82 lakh. Other income increased to Rs 9.17 crore from Rs 6.32 crore, and total tax rose to Rs 37.25 crore from Rs 32 crore.
Which geographies and segments changed in Dhanuka’s revenue mix?
Dhanuka’s North region gained the largest share of quarterly revenue, rising to 31% in Q2 FY2026-27 from 28% in Q2 FY2025-26. South’s share declined to 29% from 32%, East declined to 12% from 13%, and West increased to 28% from 27%. These shares applied to total quarterly revenue of Rs 658 crore, compared with Rs 598 crore in the company’s rounded revenue-mix presentation.
Dhanuka’s insecticides remained its largest segment at 47% of Q2 FY2026-27 revenue, up from 46% a year earlier. Fungicides fell to 25% of revenue from 29%, herbicides declined to 8% from 9%, and the Others category rose to 20% from 16%. Insecticides and Others gained revenue share, while fungicides recorded the largest percentage-point reduction among the reported segments.
Got a follow-up? Ask IRIS
What does Dhanuka’s innovation turnover index show?
Dhanuka’s new molecules represented 12.84% of total revenue in the first half (H1) of FY2026-27, down from 16.14% in H1 FY2025-26. The innovation turnover index therefore declined by 3.30 percentage points in the comparable half-year periods. The presentation defines the index as new molecules as a percentage of total revenue and does not provide rupee revenue for those molecules.
The H1 FY2026-27 figure was also below the 13.93% reported for FY2025-26 and the 14.93% recorded in FY2024-25. Earlier annual readings were 13.29% in FY2023-24 and 12.75% in FY2022-23. The disclosed annual sequence shows that new molecules’ revenue share increased through FY2024-25 before declining in FY2025-26.
What is Dhanuka’s FY2026-27 guidance?
Dhanuka’s management guided for lower-single-digit growth in revenue from operations for FY2026-27 and expects EBITDA margin to decline by approximately 125 basis points. A basis point is one-hundredth of a percentage point, making the margin indication separate from the revenue-growth guidance. The presentation does not provide a rupee revenue target, a PAT target or a quarterly forecast for the remaining period.
The guidance follows FY2025-26, when revenue from operations declined 0.75% to Rs 2,019.79 crore from Rs 2,035.15 crore in FY2024-25. EBITDA declined 3.15% to Rs 403.48 crore and PAT fell 3.28% to Rs 287.23 crore in the same annual comparison. Q2 FY2026-27 improved from the comparable quarter, while management’s full-year outlook remains for lower-single-digit sales growth and a lower EBITDA margin.
Dhanuka’s longer annual trend also shows a difference between recent revenue and margin movements. Revenue from operations rose from Rs 1,387 crore in FY2020-21 to Rs 2,020 crore in FY2025-26, while gross margin increased to 40.3% from 37.8%. However, FY2025-26 EBITDA margin was 20.0%, below 20.5% in FY2024-25, and PAT margin was 14.2%, below 14.6%.
Conclusion
Dhanuka’s Q2 FY2026-27 figures show revenue growth of 9.91%, EBITDA growth of 11.88% and PAT growth of 16.23%, with EBITDA and PAT margins increasing despite a 127-basis-point reduction in gross margin. The quarterly mix shifted toward North, insecticides and Others, while the share of revenue from new molecules declined to 12.84% in H1 FY2026-27.
The next item to watch is delivery against management’s FY2026-27 plan for lower-single-digit revenue growth and an approximately 125-basis-point EBITDA-margin reduction. Remaining-year results will show whether the Q2 improvement in PAT margin continues as gross margin, regional mix and the new-molecule revenue share evolve.