










Dhanuka FY26 revenue and profit fall from FY25 peak as margins improve
Key highlights
- Dhanuka FY26 revenue from operations fell 0.75% to Rs 2,019.79 crore from the FY25 peak of Rs 2,035.15 crore.
- FY26 gross margin improved to 40.27% from 40.10%, while gross profit declined 0.34% to Rs 813.34 crore.
- FY26 EBITDA fell 3.15% to Rs 403.48 crore, and EBITDA margin decreased to 19.98% from 20.47%.
- FY26 profit after tax declined 3.28% to Rs 287.23 crore, but remained above FY21-FY24 levels.],
powered by IRIS
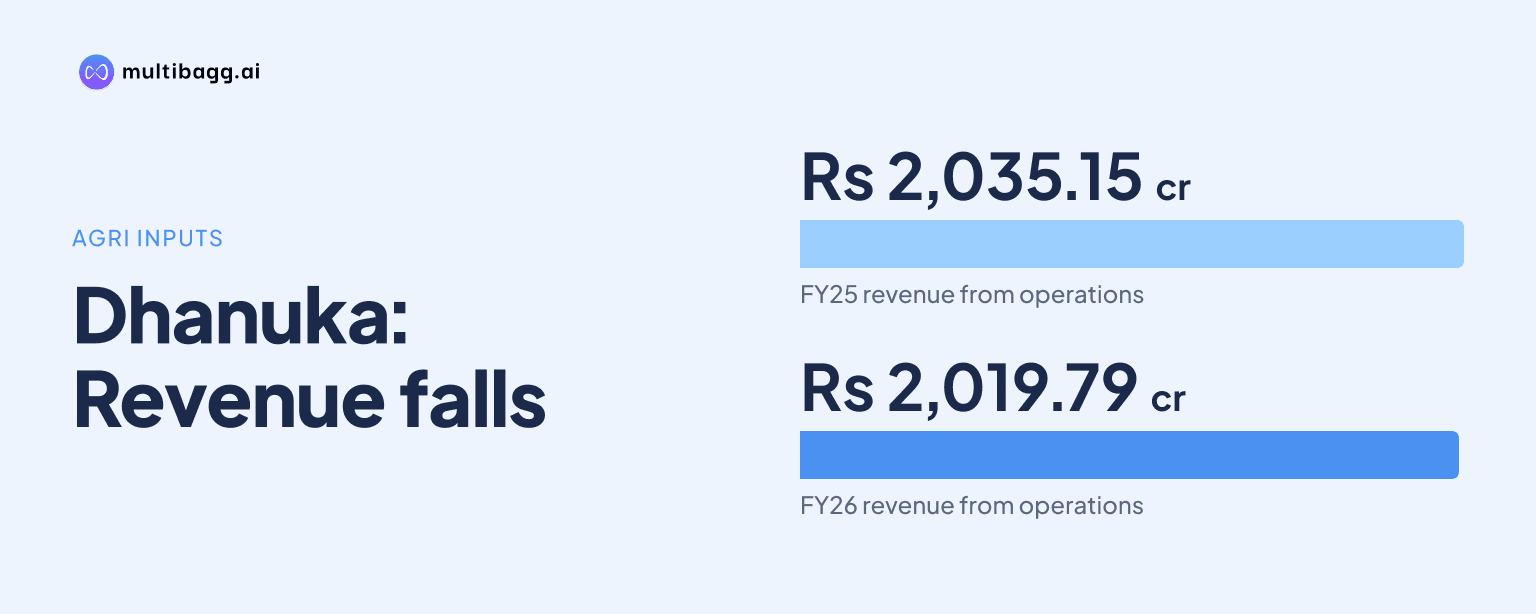
Dhanuka Agritech Limited reported lower FY26 revenue, EBITDA and profit after tax than in FY25, although its gross margin increased to 40.27% from 40.10%. Revenue from operations declined 0.75% to Rs 2,019.79 crore and profit after tax fell 3.28% to Rs 287.23 crore, following the FY25 high points in the six-year trend.
Know Dhanuka Agritech inside out
Results, valuation, peers and who's buying, in one view.
Why did Dhanuka's FY26 revenue decline?
Dhanuka's revenue from operations declined 0.75% to Rs 2,019.79 crore in FY26 from Rs 2,035.15 crore in FY25. The annual trend rounds those figures to Rs 2,020 crore and Rs 2,035 crore, respectively, making FY25 the highest revenue year in the FY21-to-FY26 series. Revenue had increased from Rs 1,387 crore in FY21 to Rs 1,700 crore in FY23 and Rs 1,759 crore in FY24 before reaching the FY25 level.
The FY26 reduction was small relative to the expansion since FY21. On the rounded annual series, FY26 revenue was Rs 633 crore above FY21 and Rs 320 crore above FY23, despite being Rs 15 crore below FY25. Cost of goods sold, or COGS, declined 1.03% to Rs 1,206.45 crore from Rs 1,219.06 crore, alongside the lower sales base.
Did Dhanuka's gross margin improve in FY26?
Dhanuka's gross margin improved to 40.27% in FY26 from 40.10% in FY25, while gross profit declined 0.34% to Rs 813.34 crore from Rs 816.09 crore. Gross margin is gross profit as a percentage of sales. Gross profit therefore fell by less than revenue, which declined 0.75% year on year.
FY26 gross margin was 6.27 percentage points above the 34.0% recorded in FY23 on the annual trend. The measure had declined from 37.8% in FY21 to 36.5% in FY22 and 34.0% in FY23, then rose to 39.0% in FY24, 40.1% in FY25 and 40.3% in FY26. The detailed income statement's 40.27% figure provides the unrounded FY26 result.
The difference between sales and gross-profit movements shows the margin change. Revenue was lower by Rs 15.36 crore in FY26, while gross profit was lower by Rs 2.75 crore. Dhanuka did not provide a specific explanation for the gross-margin movement in the disclosed annual income statement.
How did Dhanuka's operating profit change in FY26?
Dhanuka's earnings before interest, tax, depreciation and amortisation, or EBITDA, declined 3.15% to Rs 403.48 crore in FY26 from Rs 416.61 crore in FY25. EBITDA margin declined to 19.98% from 20.47%, a 0.49-percentage-point reduction. The rounded annual trend shows FY26 EBITDA of Rs 403 crore, compared with Rs 417 crore in FY25 and Rs 279 crore in FY23.
Employee benefit expenses increased 10.32% to Rs 189.83 crore in FY26 from Rs 172.07 crore in FY25, whereas other expenses declined 3.25% to Rs 220.03 crore from Rs 227.42 crore. EBITDA fell by Rs 13.13 crore, more than the Rs 2.75 crore decrease in gross profit. The presentation reports these cost movements but does not identify a management-provided cause.
Earnings before interest and tax, or EBIT, decreased 6.06% to Rs 339.26 crore from Rs 361.15 crore, as depreciation and amortisation increased 15.80% to Rs 64.22 crore. Other income rose 19.14% to Rs 43.01 crore and finance cost declined 27.40% to Rs 3.71 crore. Consequently, profit before tax fell 3.46% to Rs 378.56 crore from Rs 392.14 crore.
How did Dhanuka's FY26 net profit compare with earlier years?
Dhanuka's profit after tax, or PAT, declined 3.28% to Rs 287.23 crore in FY26 from Rs 296.96 crore in FY25. PAT margin decreased to 14.22% from 14.59%, while basic earnings per share declined 2.79% to Rs 63.72 from Rs 65.55. Total tax fell 4.04% to Rs 91.33 crore from Rs 95.18 crore.
The FY26 PAT remained above the previous four years in the annual trend, despite being below FY25. The rounded FY26 PAT of Rs 287 crore exceeded Rs 239 crore in FY24, Rs 234 crore in FY23, Rs 209 crore in FY22 and Rs 211 crore in FY21. However, it was Rs 10 crore below the FY25 PAT of Rs 297 crore.
PAT margin followed a different path from gross margin. It fell from 15.2% in FY21 to 14.1% in FY22, 13.7% in FY23 and 13.6% in FY24, before rising to 14.6% in FY25 and easing to 14.2% in FY26. Thus, FY26 combined a higher gross margin than FY25 with lower EBITDA and PAT margins.
What do Dhanuka's innovation and segment figures show?
Dhanuka reported that new molecules accounted for 13.93% of FY26 revenue, compared with 14.93% in FY25 and 12.75% in FY23. The company describes this measure as new molecules as a percentage of total revenue. The ratio rose to 13.29% in FY24 before declining by 1.00 percentage point in FY26 from its FY25 level.
In H1 FY27, new molecules represented 12.84% of total revenue, compared with 16.14% in H1 FY26. The presentation therefore shows a 3.30-percentage-point year-on-year decrease in the half-year ratio. It does not give a revenue amount for new molecules in either half-year period.
Dhanuka's Q2 FY27 revenue mix also changed from Q2 FY26. Insecticides represented 47% of Q2 FY27 revenue, up from 46%; fungicides represented 25%, down from 29%; herbicides represented 8%, down from 9%; and other categories represented 20%, up from 16%. Total Q2 FY27 revenue was Rs 657.51 crore, 9.91% above Rs 598.25 crore in Q2 FY26, while EBITDA increased to Rs 152.97 crore from Rs 136.73 crore.
Conclusion
Dhanuka's FY26 results marked a retreat from FY25 in revenue, EBITDA and PAT, while gross margin continued its recovery from the FY23 low. FY26 revenue was Rs 2,019.79 crore, EBITDA was Rs 403.48 crore and PAT was Rs 287.23 crore; gross margin reached 40.27%, compared with 34.0% in FY23 on the annual trend.
The presentation does not disclose a forward revenue target, profit target, operating plan or scheduled financial event. Its latest disclosed indicators are the 12.84% new-molecule share in H1 FY27, down from 16.14% in H1 FY26, and Q2 FY27 revenue of Rs 657.51 crore, with insecticides accounting for 47% of the segment mix.