










Dr Lal PathLabs Q2 profit rose 27.5% as margin hit 32.1%
Key highlights
- Dr Lal PathLabs reported Q2 FY27 revenue of Rs 874 crore, up 19.6% year on year.
- Dr Lal PathLabs’ Q2 FY27 PAT rose 27.5% to Rs 194 crore.
- Dr Lal PathLabs’ Q2 FY27 EBITDA margin increased to 32.1% from 30.7%.
- Dr Lal PathLabs processed 28.8 million samples in Q2 FY27, up 13.6% year on year.
powered by IRIS
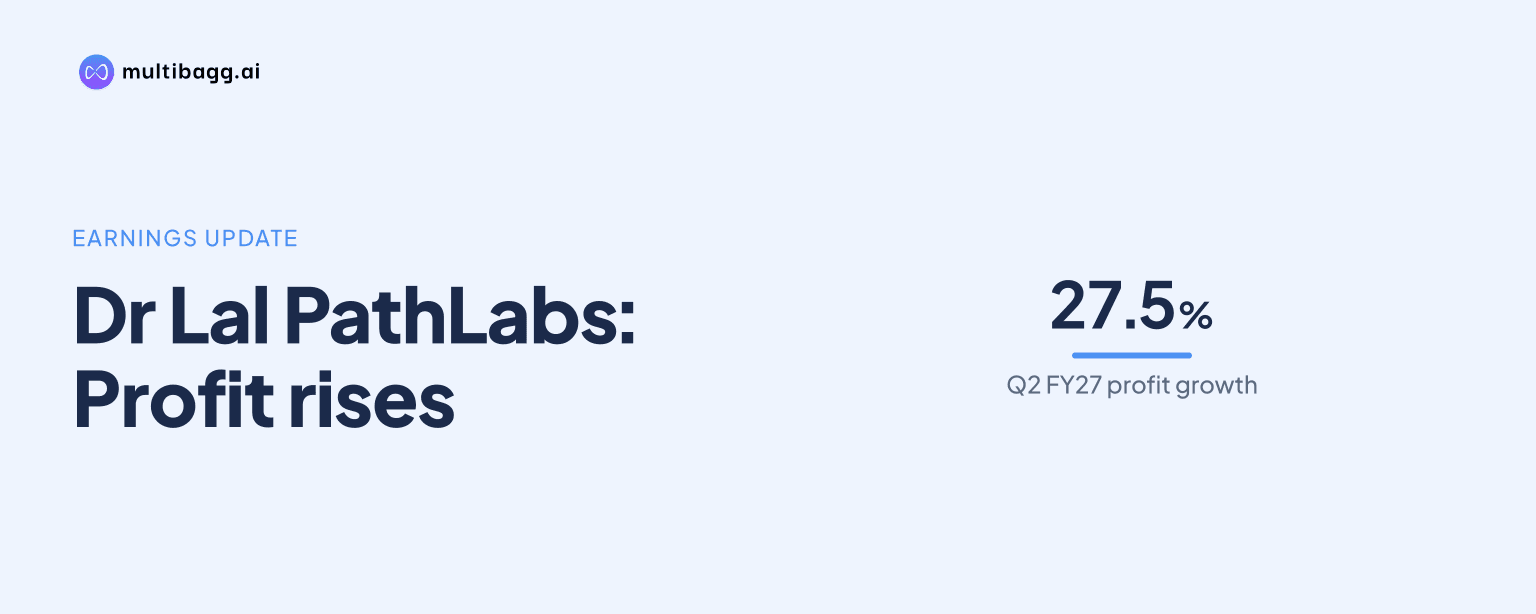
Dr Lal PathLabs Limited reported profit after tax of Rs 194 crore in the second quarter (Q2) of fiscal year (FY) 2027, up 27.5% year on year, as revenue rose 19.6% to Rs 874 crore and EBITDA margin reached 32.1%, compared with 30.7% in Q2 FY26. Earnings growth exceeded both revenue and volume growth.
Know Dr Lal Pathlabs inside out
Results, valuation, peers and who's buying, in one view.
How did Dr Lal PathLabs perform in Q2 FY27?
Dr Lal PathLabs reported revenue of Rs 874 crore in Q2 FY27, earnings before interest, tax, depreciation and amortisation (EBITDA) of Rs 280 crore, and profit after tax (PAT) of Rs 194 crore. Revenue increased by Rs 143 crore from Q2 FY26, while EBITDA increased by Rs 56 crore and PAT by Rs 42 crore.
EBITDA grew 25.1%, ahead of the 19.6% revenue increase, while PAT rose 27.5%. Profit before tax (PBT) rose 28.1% to Rs 261 crore from Rs 204 crore. Basic earnings per share increased to Rs 11.5 from Rs 9.0 in the corresponding quarter.
The reported cost lines rose in absolute terms but at a slower aggregate pace than revenue. Material consumed increased to Rs 162 crore from Rs 142 crore, employee benefit expenses to Rs 139 crore from Rs 124 crore, fees to collection centres to Rs 129 crore from Rs 109 crore, and other expenses to Rs 164 crore from Rs 132 crore.
Other income rose to Rs 34 crore from Rs 25 crore in Q2 FY26, while depreciation increased to Rs 47 crore from Rs 41 crore and finance cost rose to Rs 7 crore from Rs 5 crore. Income tax was Rs 67 crore, compared with Rs 51 crore a year earlier, following the Rs 57 crore increase in PBT.
What drove Dr Lal PathLabs’ Q2 FY27 revenue growth?
Dr Lal PathLabs’ Q2 FY27 revenue growth was supported by a 9.0% increase in patients to 9.0 million and a 13.6% increase in samples to 28.8 million. The company said core growth was anchored by patient and sample-volume expansion.
Samples increased by 3.4 million from 25.4 million in Q2 FY26, while patients rose by 0.8 million from 8.2 million. Revenue growth of 19.6% exceeded both sample and patient growth; however, the presentation does not provide pricing or test-mix information that would separate the reasons for that difference.
SwasthFit contribution was unchanged at 26% in both Q2 FY27 and Q2 FY26. For the first half (H1) of FY27, SwasthFit contribution was also unchanged year on year at 27%, alongside revenue growth of 19.4% to Rs 1,672 crore.
Why did Dr Lal PathLabs’ profitability margins increase?
Dr Lal PathLabs’ EBITDA margin increased by 140 basis points to 32.1% in Q2 FY27, while PAT margin rose by 140 basis points to 22.2%. One basis point equals one-hundredth of a percentage point.
The presentation attributes higher operating margin to economies of scale and cost efficiencies, and says growth was driven primarily by patient and sample volumes. EBITDA grew 25.1%, compared with revenue growth of 19.6%, resulting in EBITDA representing a higher share of revenue than the 30.7% reported in Q2 FY26.
PBT margin increased to 29.8% from 27.9%, while PAT grew faster than EBITDA, at 27.5% versus 25.1%. These reported comparisons indicate operating leverage in the quarter, with the revenue increase exceeding the rise in the listed operating-cost categories in aggregate.
The H1 figures show that the margin movement was not limited to Q2. H1 FY27 EBITDA margin was 31.6%, compared with 29.7% in H1 FY26, while PAT margin was 21.8%, compared with 20.4%; EBITDA rose 26.7% to Rs 528 crore and PAT increased 27.3% to Rs 364 crore.
Got a follow-up? Ask IRIS
How is Dr Lal PathLabs expanding its diagnostic network?
Dr Lal PathLabs had 312 clinical laboratories, 7,727 patient service centres (PSCs) and 13,935 PUPs at the end of FY26. This compared with 277 laboratories, 5,102 PSCs and 10,938 PUPs in FY23.
The FY23-to-FY26 change was an addition of 35 laboratories, 2,625 PSCs and 2,997 PUPs. Annual patient count increased from 26.9 million in FY23 to 30.3 million in FY26, while annual samples rose from 72.3 million to 94.5 million over the same period.
Network volumes continued to rise in H1 FY27. Dr Lal PathLabs served 17.2 million patients, up from 15.8 million in H1 FY26, and processed 54.7 million samples, compared with 48.8 million a year earlier.
Revenue from Tier 3 and smaller markets increased from Rs 685 crore in FY23 to Rs 1,090 crore in FY26, representing a compound annual growth rate of 16.7%. This segment accounted for 39% of FY26 revenue, up from 34% in FY23, while total revenue rose from Rs 2,017 crore to Rs 2,763 crore.
What is Dr Lal PathLabs focusing on after Q2 FY27?
Dr Lal PathLabs management said it is expanding access to advanced diagnostics in genomics, oncology, reproductive health, transplant diagnostics and rare diseases. The chief executive officer said investments in scientific expertise, technology and innovation are intended to address evolving patient needs.
The executive chairman said increasing screening, early detection, precision medicine and genomics could increase the need for confirmatory diagnostics and long-term disease monitoring. These statements describe management’s view of future healthcare demand rather than a disclosed revenue forecast.
The group chief financial officer and chief executive officer for international business said Dr Lal PathLabs is balancing growth investments with profitability and improving network productivity. The presentation identifies scientific excellence and research and development, network expansion, technology-driven engagement and scaling international presence as strategic growth levers, but gives no financial target, capital-expenditure amount or timetable for them.
Dr Lal PathLabs reported cash and cash equivalents of Rs 1,746 crore in H1 FY27, compared with Rs 1,526 crore at FY26-end. Return on capital employed, excluding cash and investments, was reported at 62% in H1 FY27, compared with 44% in FY26.
Conclusion
Dr Lal PathLabs’ Q2 FY27 results show earnings and margin growth ahead of revenue and volume growth. PAT rose 27.5% and EBITDA increased 25.1%, compared with revenue growth of 19.6%, while EBITDA margin reached 32.1% and sample volume increased 13.6% to 28.8 million.
The next results will show whether H1 FY27’s 31.6% EBITDA margin is sustained as the network expands and Tier 3 and smaller markets remain a larger part of revenue. Management has identified advanced diagnostics, network expansion, technology-driven engagement and international presence as priorities, but the presentation does not disclose targets or a schedule for those initiatives.