










Dr Lal PathLabs lifted Tier 3+ revenue share to 39% in FY26
Key highlights
- Dr Lal PathLabs’ Tier 3+ revenue increased to Rs 1,090 crore in FY26 from Rs 685 crore in FY23.
- Dr Lal PathLabs reported that Tier 3+ markets contributed 39% of FY26 revenue, up from 34% in FY23.
- Dr Lal PathLabs reported a 16.7% CAGR for Tier 3+ revenue from FY23 to FY26.
- Dr Lal PathLabs had 312 clinical laboratories, 7,727 PSCs and 13,935 PUPs in FY26.
powered by IRIS
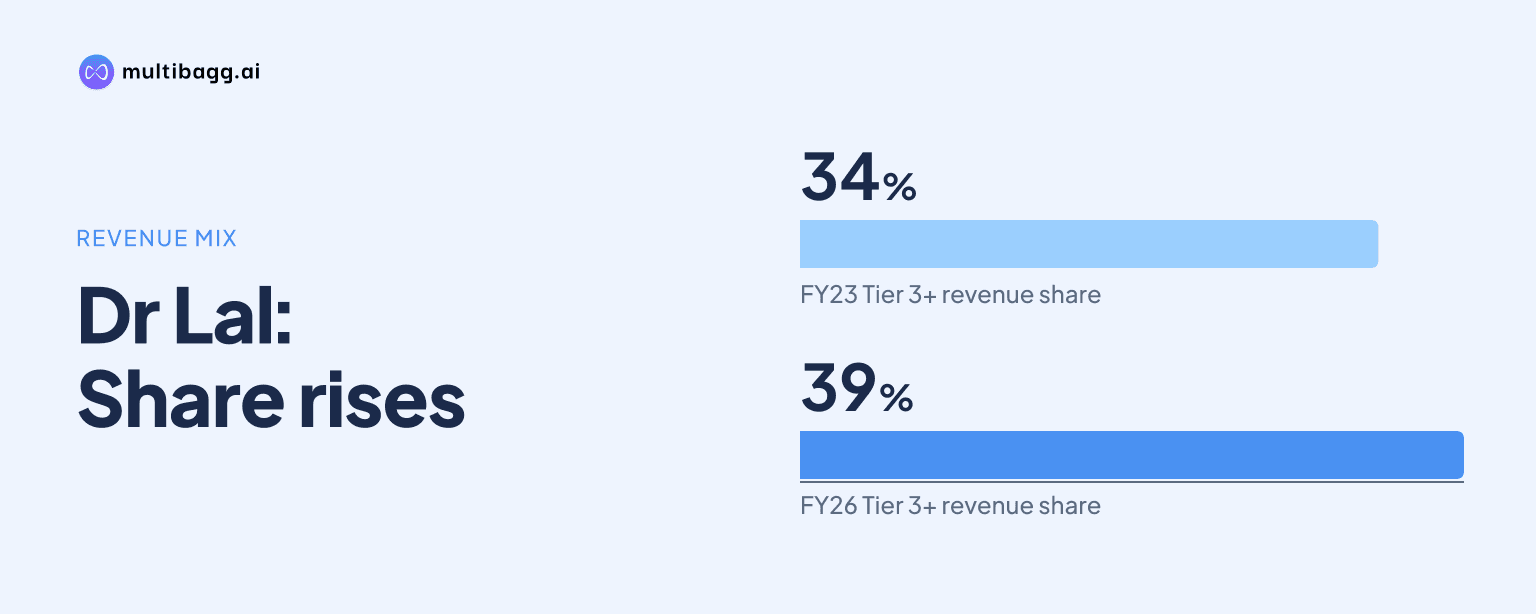
Dr Lal PathLabs increased revenue from Tier 3+ markets to Rs 1,090 crore in FY26, raising their share of total revenue to 39% from 34% in FY23. DLPL reported a 16.7% compound annual growth rate, or CAGR, for Tier 3+ revenue from FY23 to FY26, compared with total revenue of Rs 2,763 crore in FY26.
Know Dr Lal Pathlabs inside out
Results, valuation, peers and who's buying, in one view.
How much did DLPL’s Tier 3+ revenue grow?
DLPL’s Tier 3+ revenue increased by Rs 405 crore over three financial years, from Rs 685 crore in FY23 to Rs 1,090 crore in FY26. The company reported a 16.7% CAGR for this revenue stream, while total revenue rose from Rs 2,017 crore in FY23 to Rs 2,763 crore in FY26.
The annual sequence shows growth in each reported year. Tier 3+ revenue was Rs 789 crore in FY24 and Rs 917 crore in FY25 before reaching Rs 1,090 crore in FY26. The increase between FY25 and FY26 was Rs 173 crore, compared with an increase of Rs 128 crore between FY24 and FY25.
The reported figures show that Tier 3+ markets accounted for Rs 405 crore of the Rs 746 crore increase in total revenue between FY23 and FY26. This is an arithmetic comparison of the disclosed figures; DLPL does not attribute every increment in Tier 3+ revenue to a specific operating initiative.
What changed in DLPL’s revenue mix by FY26?
DLPL increased Tier 3+ markets’ share of revenue by 5 percentage points, to 39% in FY26 from 34% in FY23. The share rose in every disclosed year, moving to 35% in FY24 and 37% in FY25 before reaching 39% in FY26.
The mix shift occurred while total revenue expanded each year of the series. DLPL reported total revenue of Rs 2,227 crore in FY24, Rs 2,461 crore in FY25 and Rs 2,763 crore in FY26, compared with Rs 2,017 crore in FY23. Tier 3+ revenue therefore rose from just over one-third of revenue to just under two-fifths over the period.
DLPL does not disclose revenue, patient volumes or test categories for individual Tier 3+ cities. The presentation establishes the segment’s revenue, growth rate and share of company revenue, but does not identify whether routine tests, preventive packages or specialised diagnostics drove the Rs 1,090 crore reported in FY26.
Where was DLPL’s FY26 revenue concentrated?
DLPL’s largest reported geographic revenue share in FY26 was Delhi and the National Capital Region, or NCR, at 31%, followed by Uttar Pradesh and Uttarakhand at 19%. East India accounted for 15%, West India for 14%, the rest of North India for 13%, South India for 6% and other areas for 2%.
These regional shares are a different revenue classification from Tier 3+ markets. DLPL does not map Tier 3+ revenue to Delhi and NCR, Uttar Pradesh and Uttarakhand, or its other reported regions. The 39% Tier 3+ share therefore cannot be allocated across the seven regional categories from the supplied data.
The geography chart shows that 69% of FY26 revenue came from regions outside Delhi and NCR, while the separate Tier 3+ measure recorded Rs 1,090 crore of revenue. Both measures describe DLPL’s geographic footprint, but they do not use the same definitions and should not be combined to calculate regional Tier 3+ revenue.
Got a follow-up? Ask IRIS
Did DLPL expand its operating network alongside Tier 3+ growth?
DLPL expanded its clinical laboratory, patient service centre and pickup-point network between FY23 and FY26 as Tier 3+ revenue rose from Rs 685 crore to Rs 1,090 crore. Clinical laboratories increased by 35 to 312, patient service centres, or PSCs, increased by 2,625 to 7,727, and pickup points, or PUPs, increased by 2,997 to 13,935.
The largest reported network increase was in PUPs, followed by PSCs. From FY25 to FY26, clinical laboratories rose from 298 to 312, PSCs from 6,607 to 7,727, and PUPs from 12,365 to 13,935. DLPL does not disclose how many of these additions were in Tier 3+ markets.
Patient and sample volumes also grew through FY26. DLPL reported 30.3 million patients and 94.5 million samples in FY26, compared with 26.9 million patients and 72.3 million samples in FY23. In H1 FY27, it reported 17.2 million patients and 54.7 million samples, compared with 15.8 million patients and 48.8 million samples in H1 FY26.
The disclosure shows concurrent growth in revenue, network counts and volumes, rather than a direct measure of network productivity in smaller cities. DLPL does not provide revenue per laboratory, PSC or PUP nationally or for Tier 3+ markets, despite reporting FY26 total revenue of Rs 2,763 crore and a Tier 3+ share of 39%.
Conclusion
DLPL’s FY26 data show that Tier 3+ markets became a larger component of its revenue base, contributing Rs 1,090 crore and 39% of revenue, compared with Rs 685 crore and 34% in FY23. Over the same period, total revenue increased by Rs 746 crore, clinical laboratories reached 312 and patient volumes reached 30.3 million.
What to watch next is whether management’s stated plan to expand access to advanced diagnostics through scientific expertise, technology and innovation is accompanied by further Tier 3+ disclosures. DLPL has not provided a Tier 3+ revenue target or city-level network plan, making future revenue mix, network counts and patient or sample volumes the relevant measures after H1 FY27 revenue of Rs 1,672 crore.