










Excel Industries Limited Q2 profit rises 42.4% to ₹26.67 crore
Key highlights
- Excel Industries reported Q2 FY27 standalone revenue from operations of ₹274.61 crore, up 1.6% year-on-year.
- Standalone Q2 FY27 profit after tax rose 42.4% to ₹26.67 crore from ₹18.73 crore.
- Q2 FY27 total expenses were ₹249.08 crore, compared with ₹249.87 crore a year earlier.
- H1 FY27 standalone PAT increased 6.7% to ₹55.78 crore despite a 2.0% decline in revenue.
powered by IRIS
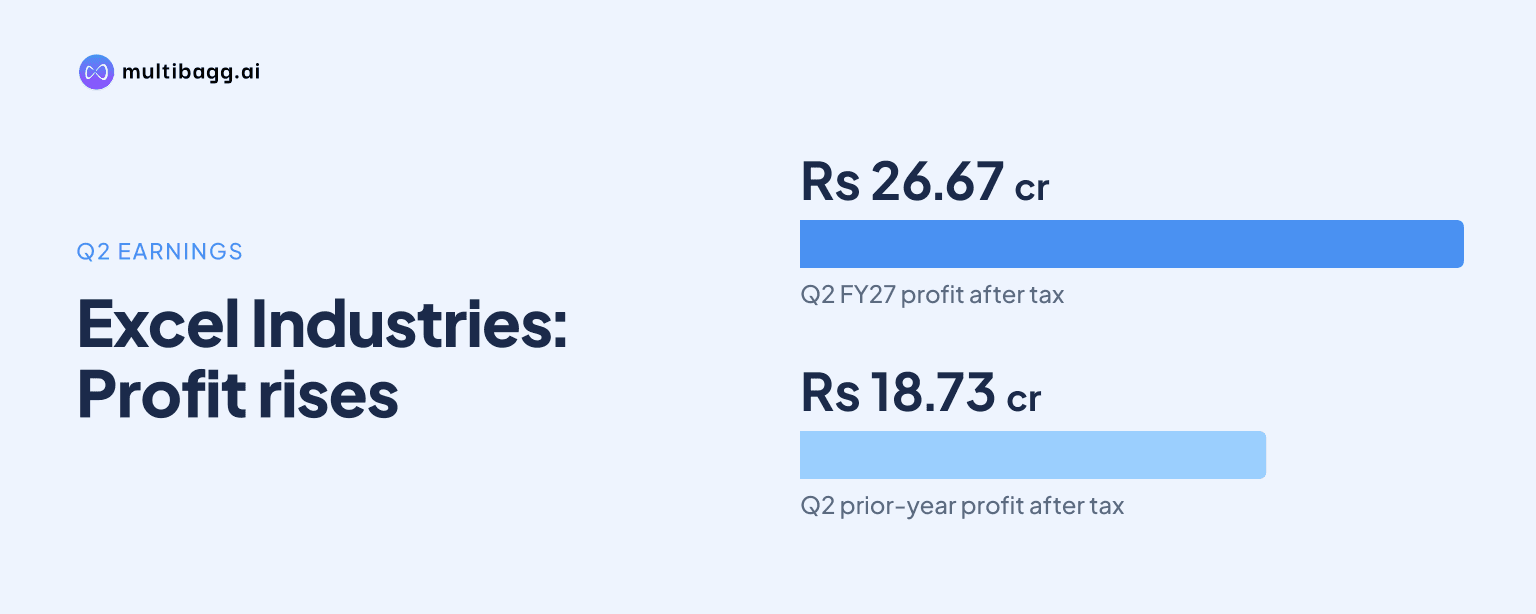
Excel Industries Limited reported standalone profit after tax of ₹26.67 crore for the quarter ended September 30, 2026, up 42.4% from ₹18.73 crore a year earlier, while revenue from operations increased 1.6% to ₹274.61 crore. The result indicates improved profitability despite modest year-on-year revenue growth.
Know Excel Industries inside out
Results, valuation, peers and who's buying, in one view.
What did Excel Industries report for Q2 FY27?
Excel Industries reported its unaudited standalone results for Q2 FY27 after a Board meeting held on November 4, 2026. Revenue from operations for the July-September quarter was ₹274.61 crore, compared with ₹270.19 crore in Q2 FY26. Total income rose 3.5% to ₹284.09 crore from ₹274.41 crore, helped by higher other income.
Standalone profit before tax increased to ₹35.02 crore from ₹24.54 crore in the corresponding quarter of the previous year. Profit after tax rose to ₹26.67 crore from ₹18.73 crore. Basic and diluted earnings per share were ₹21.21, compared with ₹14.90 in Q2 FY26.
Why did Excel Industries' profit grow faster than revenue?
Excel Industries' profit growth outpaced its revenue growth because expenses stayed broadly controlled while income increased. Total expenses for the quarter were reported at ₹249.08 crore, compared with ₹249.87 crore in the year-earlier quarter. This was lower despite the increase in revenue from operations.
The company also recorded other income of ₹9.48 crore, more than double the ₹4.22 crore reported in Q2 FY26. The combination of stable expenses, incremental operating revenue and higher other income lifted profit before tax by ₹10.48 crore year-on-year. The reported data therefore points to improved cost management and a more favourable income mix during the quarter.
The supplied results information also refers to an EBITDA margin of about 12.7% for the standalone business in Q2 FY27. This calculation is linked to the disclosed quarterly figures and reflects the gap between operating income and expenses. Excel Industries did not provide a separate management commentary in the supplied material detailing individual product, volume or pricing factors.
Got a follow-up? Ask IRIS
How did the first half of FY27 compare with last year?
Excel Industries reported H1 FY27 standalone revenue from operations of ₹568.34 crore, compared with ₹579.66 crore in H1 FY26. Revenue for the first six months was therefore lower by ₹11.32 crore year-on-year, even though the September-quarter revenue was marginally higher than the previous year's quarter.
H1 standalone profit after tax nevertheless rose 6.7% to ₹55.78 crore from ₹52.29 crore. Profit before tax increased to ₹73.49 crore from ₹68.78 crore, while total income declined to ₹583.99 crore from ₹595.67 crore. H1 basic and diluted EPS improved to ₹44.37 from ₹41.60.
The half-year figures show that profitability improved despite lower revenue. For investors, this makes the composition of future revenue and the company's ability to retain cost discipline relevant factors. The source material notes anticipated raw-material volatility in Q1 FY27, while also describing the balance sheet as net cash positive.
What do the consolidated results show for investors?
Excel Industries reported consolidated Q2 FY27 revenue from operations of ₹274.68 crore and profit after tax of ₹28.90 crore. Consolidated total income was ₹287.12 crore and profit before tax was ₹37.78 crore. The small difference between standalone and consolidated revenue suggests that the core business remained the principal contributor to group sales.
For H1 FY27, consolidated revenue from operations was ₹568.51 crore and consolidated profit after tax was ₹58.36 crore. Consolidated EPS for the half year stood at ₹46.43. These figures were higher than the corresponding standalone profit measures, reflecting the contribution from consolidated entities.
The quarter's key market-relevant feature is the difference between sales growth and profit growth. Revenue from operations increased by only 1.6% year-on-year on a standalone basis, whereas PAT grew 42.4%. This places greater attention on expense trends, other income and margins when assessing the quality and repeatability of earnings growth.
Excel Industries has scheduled an earnings call for November 6, 2026, at 1:30 PM IST to discuss the Q2 and H1 FY27 results. Analysts and shareholders may look for details on operating conditions, raw-material costs, demand trends and the reasons for the difference between quarterly and half-year revenue movement.
Conclusion
Excel Industries delivered a stronger Q2 FY27 bottom line, with standalone PAT rising to ₹26.67 crore while revenue from operations reached ₹274.61 crore. Controlled expenses and higher other income supported the improvement, while first-half revenue remained below the prior-year level despite higher H1 profit.
The November 6 earnings call is the next disclosed event for investors to monitor. Management's discussion of raw-material conditions, revenue trends and the sustainability of cost controls will provide further context for the Q2 margin improvement and the lower H1 revenue base.