










Godrej Chemicals says Q2 tailwinds will fade later in FY27
Key highlights
- Chemicals' Q2 FY27 total income rose 26% year on year to Rs 1,335 crore.
- Chemicals' Q2 FY27 sales volume increased 13% and PBIT rose 18% to Rs 114 crore.
- H1 FY27 total income increased 28% to Rs 2,495 crore, while PBIT rose 49% to Rs 273 crore.
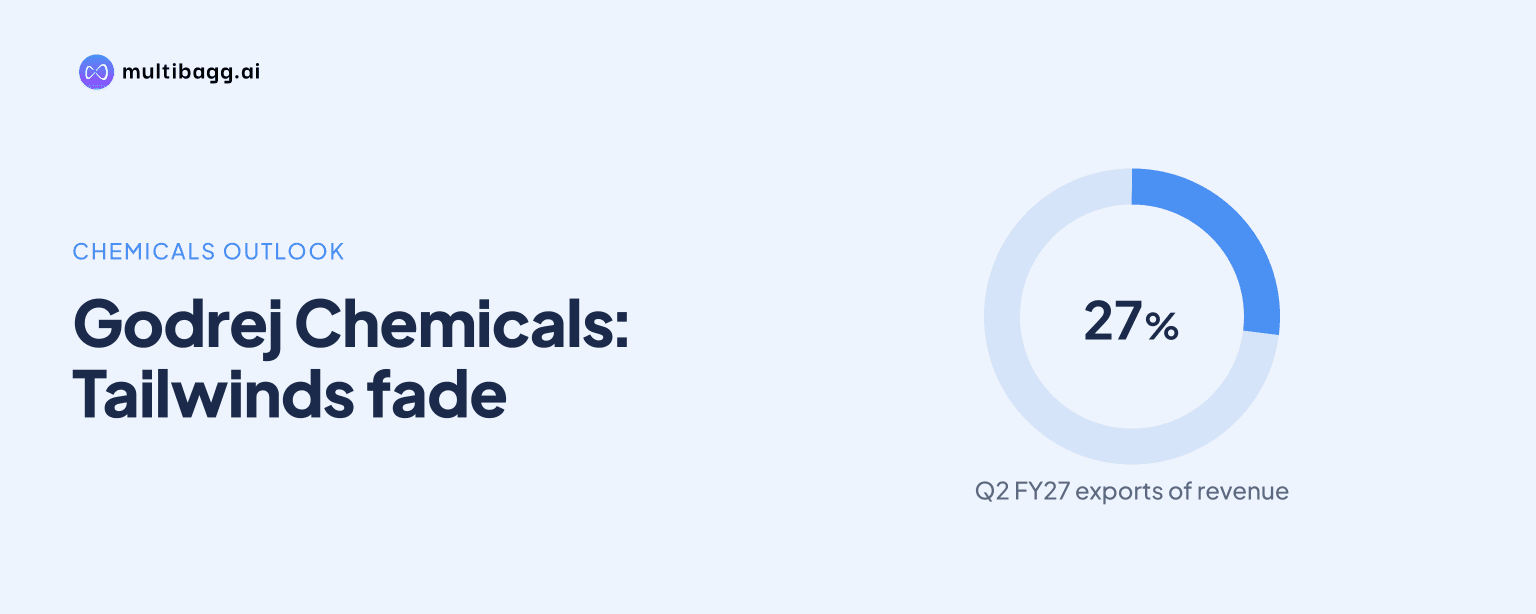
- Exports grew 10% in Q2 and H1 FY27 and accounted for 27% of segment revenue.
powered by IRIS
Godrej Chemicals said Q2 FY27 revenue rose 26% year on year to Rs 1,335 crore, but management expects the West Asia war response, supply-demand mismatch and inflationary tailwinds to normalize during the rest of FY27. Sales volume rose 13% and profit before interest and tax (PBIT) increased 18% to Rs 114 crore in the quarter.
Know Godrej Industries inside out
Results, valuation, peers and who's buying, in one view.
What drove Chemicals' Q2 FY27 performance?
Chemicals attributed its Q2 FY27 performance to a rapid and resilient response to the West Asia war, alongside tailwinds from a demand-supply mismatch and an inflationary environment. These conditions supported revenue of Rs 1,335 crore, compared with Rs 1,059 crore in Q2 FY26, while sales volumes increased 13% year on year.
The reported revenue growth exceeded volume growth in the quarter, with revenue up 26% and volume up 13%. The presentation does not break out pricing, product mix or individual product contributions, so it does not quantify how much of the difference between revenue and volume growth arose from realizations or mix.
PBIT rose 18% to Rs 114 crore in Q2 FY27 from Rs 97 crore in Q2 FY26. Chemicals is a division of Godrej Industries Limited, so the company uses PBIT rather than profit after tax to assess performance at the strategic business unit level.
How did Chemicals perform in the first half of FY27?
Chemicals delivered faster growth in H1 FY27 than in Q2 alone, with revenue rising 28% to Rs 2,495 crore and PBIT increasing 49% to Rs 273 crore. H1 refers to the first half of the fiscal year, while year-on-year comparisons use H1 FY26 as the prior period.
The half-year comparison shows that PBIT grew faster than total income, at 49% versus 28%. In Q2, however, PBIT growth of 18% trailed the 26% increase in total income, showing that the quarterly growth pattern differed from the first-half result.
Sales volume increased 11% in H1 FY27, below the 13% reported for Q2 FY27. The company did not disclose H1 volume in tonnes or split volumes by chemical category, but the reported figures show that the second-quarter volume growth rate was 2 percentage points above the first-half rate.
How significant were exports in Chemicals' results?
Exports accounted for 27% of Chemicals' revenue and grew 10% year on year in both Q2 and H1 FY27. Against reported Q2 total income of Rs 1,335 crore, exports remained a material part of segment revenue, although the presentation does not disclose export revenue in rupees.
Export growth was below the segment's 26% Q2 revenue growth and 28% H1 revenue growth. The source therefore reports faster growth in the overall business than in exports, but does not identify destination markets, products, pricing changes or domestic sales performance behind the gap.
Chemicals also received the Confederation of Indian Industry, or CII, National Award for Excellence in Energy Management during the reported period. The presentation names the recognition but provides no financial value, energy-saving metric or indication that it affected Q2 revenue of Rs 1,335 crore or PBIT of Rs 114 crore.
Got a follow-up? Ask IRIS
What does Chemicals' five-year record show?
Chemicals increased revenue from Rs 1,666 crore in FY21 to Rs 4,135 crore in FY26, representing an approximately 20% compound annual growth rate, or CAGR. Over the same five-year comparison, sales volume rose from 164 thousand tonnes to 248 thousand tonnes, an approximately 9% CAGR.
The 20% revenue CAGR exceeded the 9% volume CAGR from FY21 to FY26. The presentation does not provide annual realizations, inflation measures or product-level mix data for those years, so it does not establish the separate drivers of that difference.
PBIT rose from Rs 119 crore in FY21 to Rs 307 crore in FY26, an approximately 21% CAGR. That PBIT growth rate was slightly higher than the 20% revenue CAGR over the five-year period, while FY26 PBIT of Rs 307 crore provides the latest full-year benchmark against H1 FY27 PBIT of Rs 273 crore.
Why does management expect conditions to normalize?
Management said the rest of FY27 is expected to return to normal without the tailwinds that aided Q2 and H1 performance. Its stated reasons are specific: the rapid response to the West Asia war, the demand-supply mismatch and the inflationary environment were unusual supports to the period's results.
The statement is management's outlook rather than a quantified forecast. Chemicals gave no revenue, volume, PBIT, margin or export target for the remainder of FY27, and did not specify when the demand-supply mismatch would end or how normal conditions would compare with Q2 FY27 revenue of Rs 1,335 crore.
The caution accompanies H1 FY27 revenue growth of 28%, volume growth of 11% and PBIT growth of 49%. The presentation supports the reported H1 FY27 outcome, but does not support assuming that the West Asia-related response and market tailwinds will recur in later quarters.
Conclusion
Chemicals reported higher Q2 FY27 revenue, volume and PBIT, while H1 FY27 PBIT growth of 49% exceeded the 28% increase in total income. Exports grew 10% and represented 27% of segment revenue, and the FY21-to-FY26 record shows revenue rising from Rs 1,666 crore to Rs 4,135 crore and PBIT from Rs 119 crore to Rs 307 crore.
The next results will show how performance changes as the conditions identified by management normalize during the rest of FY27. The disclosed measures to watch are whether revenue growth remains near the H1 FY27 rate of 28%, whether volume growth holds above the 11% first-half rate, and how PBIT develops after the stated tailwinds fade.