










Godrej Industries Q2 income rises 33%, finance drives PBIT
Key highlights
- Godrej Industries reported Q2 FY27 consolidated income of Rs 8,387 crore, up 33% year on year.
- Finance & Investments generated Rs 485 crore of Q2 FY27 PBIT, equal to 48.8% of profit-making segment PBIT.
- Estate & Property Development had the largest Q2 segment revenue at Rs 2,562 crore but contributed 12.4% of segment PBIT.
- H1 FY27 net profit rose 43% to Rs 844 crore from Rs 592 crore.
powered by IRIS
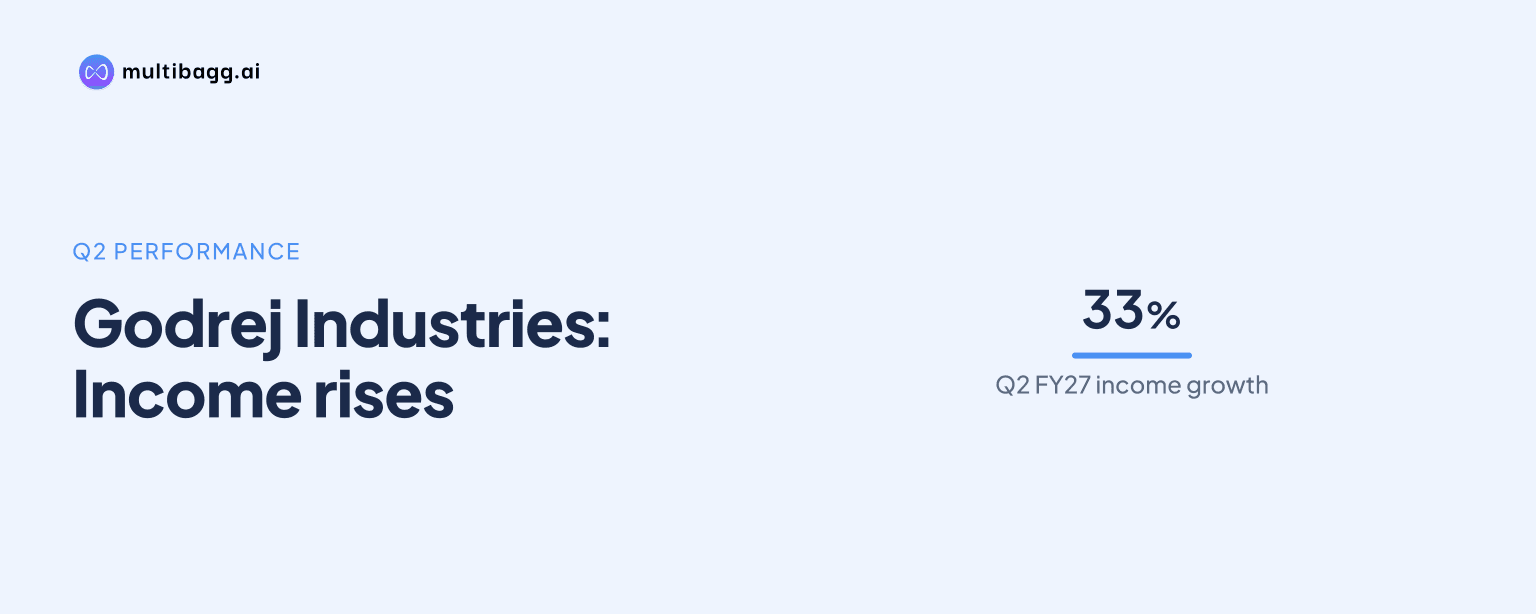
Godrej Industries Limited reported consolidated total income of Rs 8,387 crore in Q2 FY27, 33% above Q2 FY26, while Finance & Investments supplied 48.8% of PBIT across profit-making segments. The November 13, 2026 presentation shows that income growth and segment profit concentration are different measures because segment figures are before inter-segment eliminations.
Know Godrej Industries inside out
Results, valuation, peers and who's buying, in one view.
What did Godrej Industries report for Q2 FY27?
Godrej Industries reported consolidated total income of Rs 8,387 crore for Q2 FY27, compared with Rs 6,290 crore in Q2 FY26, a 33% increase. Profit before depreciation, interest and tax, or PBDIT, rose 16% to Rs 1,653 crore from Rs 1,428 crore, while profit before interest and tax, or PBIT, increased 15% to Rs 1,503 crore from Rs 1,307 crore.
Net profit, including the share of profit in associates and after reducing non-controlling interest, was Rs 560 crore in Q2 FY27, up 131% from Rs 242 crore a year earlier. Interest was Rs 807 crore, compared with Rs 584 crore in Q2 FY26, and depreciation was Rs 149 crore against Rs 121 crore, so the increase in net profit exceeded the gains reported at the PBDIT and PBIT levels.
Why did Finance & Investments dominate Godrej Industries’ Q2 segment PBIT?
Finance & Investments generated Rs 485 crore of Q2 FY27 PBIT, representing 48.8% of the PBIT reported by profit-making segments, despite contributing 20.2% of segment revenue. Its Rs 1,779 crore revenue was lower than Estate & Property Development’s Rs 2,562 crore, yet Estate & Property Development contributed Rs 123 crore of PBIT and 12.4% of the profit-making segment total.
The contrast is also visible against Veg Oils, which produced Rs 913 crore of revenue and Rs 165 crore of PBIT, equal to 10.3% of revenue mix and 16.6% of PBIT mix. Chemicals recorded Rs 1,335 crore of revenue and Rs 114 crore of PBIT, while Animal Nutrition generated Rs 1,387 crore of revenue and Rs 94 crore of PBIT. Finance & Investments therefore had the largest PBIT share even though it ranked second in Q2 segment revenue.
Which segments made losses in Godrej Industries’ Q2 FY27 mix?
Dairy and Crop Care were the only Q2 FY27 segments with negative PBIT in the presentation, at losses of Rs 4 crore and Rs 6 crore, respectively. Dairy represented Rs 415 crore, or 4.7%, of segment revenue, while Crop Care accounted for Rs 272 crore, or 3.1%; neither was assigned a PBIT mix percentage because that measure covers profit-making segments only.
The smaller reported businesses were profitable but did not materially alter the mix shown for the larger segments. Others had Rs 133 crore of revenue and Rs 6 crore of PBIT, while Hospitality posted Rs 30 crore of revenue and Rs 6 crore of PBIT; each contributed 0.6% of the PBIT mix. These figures leave Finance & Investments as the leading profit contributor within the presentation’s positive-PBIT segment measure.
Got a follow-up? Ask IRIS
How did the H1 FY27 mix differ from the Q2 FY27 mix?
Estate & Property Development led PBIT mix for H1 FY27, contributing Rs 625 crore or 31.1% of profit-making segment PBIT, while Finance & Investments contributed Rs 585 crore or 29.1%. This differs from Q2 FY27, when Finance & Investments led at 48.8% and Estate & Property Development accounted for 12.4%, showing a different mix in the half-year presentation.
Revenue rankings also varied by period. Estate & Property Development generated Rs 3,897 crore, or 25.4% of H1 segment revenue, compared with a 29.0% share in Q2; Finance & Investments recorded Rs 2,745 crore, or 17.9%, compared with 20.2% in Q2. Chemicals supplied Rs 273 crore of H1 PBIT, Veg Oils Rs 254 crore and Animal Nutrition Rs 178 crore, while Crop Care returned to positive PBIT of Rs 70 crore after its Rs 6 crore Q2 loss.
What does the half-year consolidated result show?
Godrej Industries reported H1 FY27 consolidated total income of Rs 14,747 crore, up 23% from Rs 12,009 crore in H1 FY26. PBDIT rose 3% to Rs 3,263 crore from Rs 3,176 crore, and PBIT rose 1% to Rs 2,980 crore from Rs 2,942 crore, making the half-year operating growth lower than the Q2 growth rates of 16% and 15%.
H1 FY27 net profit was Rs 844 crore, a 43% increase from Rs 592 crore in H1 FY26, while interest increased to Rs 1,552 crore from Rs 1,160 crore and depreciation rose to Rs 283 crore from Rs 234 crore. Godrej Industries states that consolidated PBDIT and PBIT include associates’ profit and exceptional items, whereas segment revenue is before elimination of inter-segment transactions, so the two presentations should not be treated as directly reconcilable totals.
Conclusion
Godrej Industries’ Q2 FY27 result combined a 33% rise in consolidated income with a segment profit mix led by Finance & Investments. The business delivered 48.8% of positive segment PBIT on 20.2% of segment revenue, whereas Estate & Property Development was the largest revenue segment at 29.0% but contributed 12.4% of the stated PBIT mix.
The next comparison to watch is whether the Q2 concentration persists or moves toward the H1 FY27 pattern, in which Estate & Property Development led with 31.1% of profit-making segment PBIT and Finance & Investments had 29.1%. Godrej Industries also identifies an FY31 ambition section in its November 13, 2026 presentation, but the supplied pages do not disclose the underlying targets or timetable.