










HP Adhesives Limited Revenue Rises 16.7%, Profit Falls 92.1%
Key highlights
- HP Adhesives reported Q2 FY27 consolidated revenue of ₹75.93 crore, up 16.7% year-on-year.
- Net profit was ₹0.28 crore in Q2 FY27, down 92.1% from ₹3.53 crore a year earlier.
- EBITDA declined 54.0% year-on-year to ₹2.93 crore, with the margin falling to 3.9% from 9.8%.
- Finance costs rose to ₹1.25 crore from ₹0.63 crore in Q2 FY26.
powered by IRIS
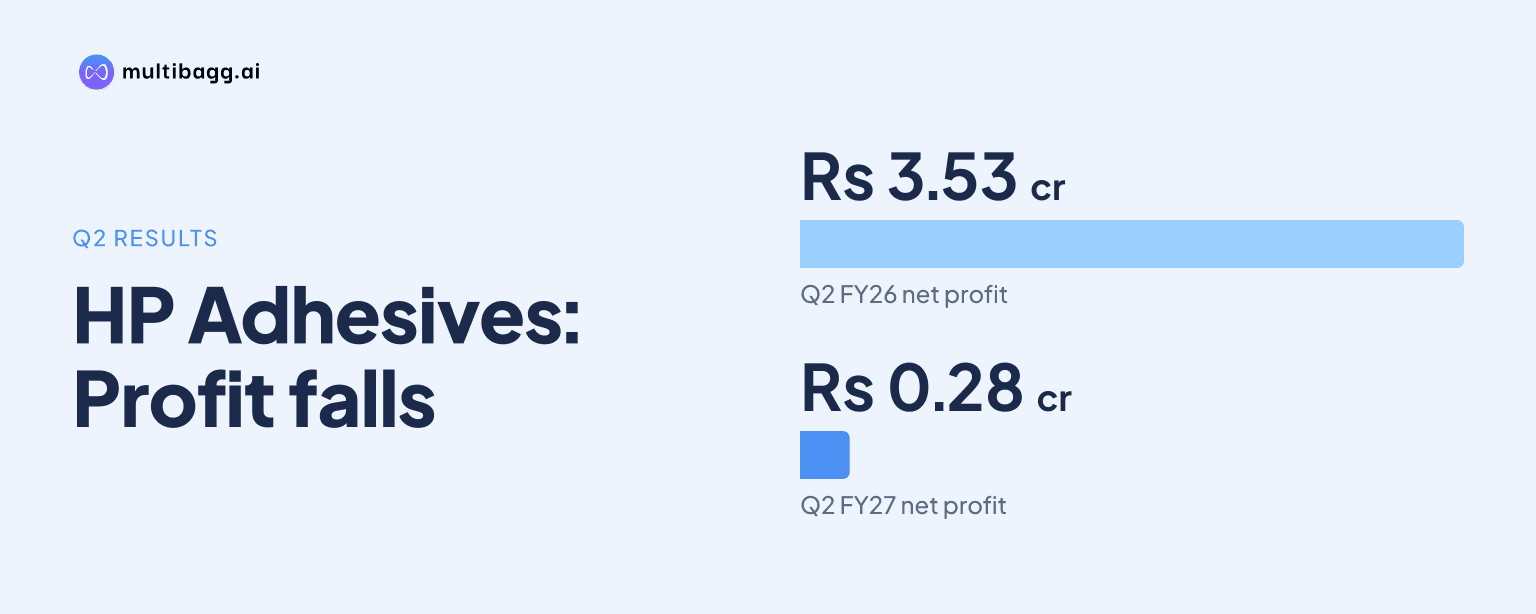
HP Adhesives Limited reported consolidated revenue of ₹75.93 crore for the quarter ended September 30, 2026, up 16.7% year-on-year, while net profit fell 92.1% to ₹0.28 crore as material and finance costs increased.
Know Hindustan Adhesives inside out
Results, valuation, peers and who's buying, in one view.
What did HP Adhesives report for Q2 FY27?
HP Adhesives reported a recovery in quarterly revenue but a substantial decline in profitability in Q2 FY27. Consolidated revenue from operations rose to ₹75.93 crore from ₹65.06 crore in the corresponding quarter of FY26. The company also recorded sequential revenue growth of 19.7% from ₹63.42 crore in Q1 FY27.
Net profit for the September 2026 quarter was ₹0.28 crore, compared with ₹3.53 crore a year earlier. Although profit returned to positive territory from a net loss of ₹0.91 crore in the preceding June 2026 quarter, it remained materially below the year-ago level. Basic and diluted earnings per share were ₹0.03, against ₹0.38 in Q2 FY26 and negative ₹0.10 in Q1 FY27.
Why did profit decline despite higher revenue?
Profit declined because expenses increased faster than revenue. Total expenses rose 24.3% year-on-year to ₹75.54 crore, compared with revenue growth of 16.7%. This cost movement narrowed operating profit despite the higher sales base.
Cost of materials consumed rose to ₹54.95 crore during the quarter, alongside inventory adjustments. The reported figures indicate higher production volumes and changing input-cost conditions. Operating profit, measured as EBITDA, consequently declined by ₹3.44 crore from the level recorded in Q2 FY26.
Finance costs also increased to ₹1.25 crore, compared with ₹0.81 crore in Q1 FY27 and ₹0.63 crore a year earlier. The company attributed the increase to higher short-term borrowings and operational financing requirements. Higher material and finance costs together reduced the benefit of revenue growth at the profit-before-tax and net-profit levels.
How did the September quarter compare with the June quarter?
The September quarter showed a sequential recovery in both revenue and profitability. Revenue rose by ₹12.51 crore from ₹63.42 crore in Q1 FY27 to ₹75.93 crore in Q2 FY27. Total income, including other income of ₹0.36 crore, reached ₹76.29 crore compared with ₹64.48 crore in the preceding quarter.
HP Adhesives moved from an EBITDA loss of ₹0.34 crore in Q1 FY27 to EBITDA of ₹2.93 crore in Q2 FY27. Profit before tax also turned positive at ₹0.74 crore after a pre-tax loss of ₹1.35 crore in the June quarter. Net profit similarly improved from a ₹0.91 crore loss to a ₹0.28 crore profit.
The sequential improvement does not change the year-on-year comparison, where margins remained weaker. EBITDA margin recovered by 4.4 percentage points from the negative margin reported in Q1 FY27, but it was still 5.9 percentage points below the 9.8% margin in Q2 FY26. This difference shows that the company restored quarterly profitability without returning to its earlier operating margin level.
Got a follow-up? Ask IRIS
When were the results approved and what do they cover?
The board approved the unaudited standalone and consolidated financial results for the quarter and half year ended September 30, 2026. The Q2 FY27 consolidated results were declared on November 5, 2026, with the reported comparisons based on the July to September quarter.
On a standalone basis, HP Adhesives reported revenue of ₹75.76 crore for Q2 FY27, up 16.3% year-on-year. Standalone net profit was ₹0.23 crore, while standalone profit before tax was ₹3.55 crore. The consolidated figures remain the appropriate basis for assessing the company’s group-level revenue, costs and profit performance.
The company’s financial update also reported a half-year loss before tax of ₹0.61 crore, compared with a profit before tax of ₹10.37 crore in H1 FY26. The half-year comparison reflects the impact of the first-quarter loss as well as the lower year-on-year profit contribution in the September quarter.
What does the result mean for investors and operations?
The result shows that HP Adhesives achieved sales growth and restored sequential profitability, but its operating costs absorbed a larger share of revenue than they did a year earlier. Revenue increased by ₹10.87 crore year-on-year, whereas EBITDA declined by ₹3.44 crore and net profit declined by ₹3.25 crore. The contrast places attention on cost management rather than sales growth alone.
For investors, the movement in EBITDA margin from 9.8% to 3.9% is a key measure of the quarter’s pressure. Increased material consumption and higher finance costs were directly identified in the financial update. The company has not disclosed a specific forward target for margins, borrowing levels or profitability in the supplied information.
For customers and industry participants, the results indicate higher production activity reflected in the rise in revenue and material consumption. However, the available filing does not provide a product-wise sales breakdown, customer demand trends, pricing changes or regional operating data. As a result, the disclosed financial information supports assessment of consolidated performance but not a detailed view of individual business segments.
Conclusion
HP Adhesives delivered 16.7% year-on-year revenue growth to ₹75.93 crore in Q2 FY27 and improved from a loss in the preceding quarter. However, net profit of ₹0.28 crore was 92.1% below the year-ago quarter as total expenses, material costs and finance costs rose faster than revenue, reducing operating margins.
The next reported financial update will be important for assessing whether the sequential recovery in revenue and profit can be sustained. Investors will particularly watch changes in material costs, finance costs, EBITDA margin and whether the company can improve on the 3.9% EBITDA margin reported for the September 2026 quarter.