










IKS Health revenue doubles as adjusted EBITDA margin falls 28.8%
Key highlights
- IKS reported Q2 FY27 revenue of Rs 1,592.5 crore, up 103.9% year-on-year, with 82 days of TruBridge consolidation.
- IKS adjusted EBITDA was Rs 459.1 crore, up 63.2% year-on-year, while adjusted EBITDA margin fell to 28.8% from 36.0%.
- IKS profit attributable to shareholders increased 20.4% year-on-year to Rs 217.6 crore in Q2 FY27.
- IKS net debt was Rs 5,280.8 crore at 30 September 2026, versus Rs 265.4 crore at 30 June 2026.
powered by IRIS
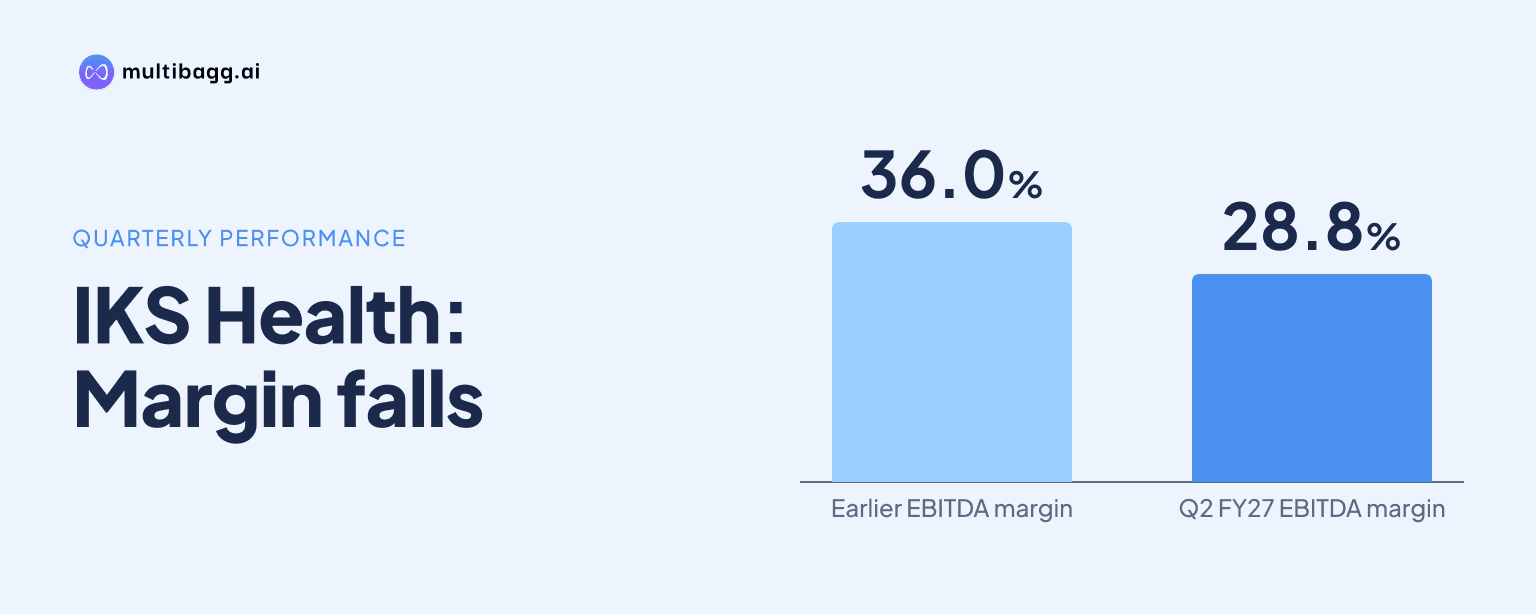
IKS Health reported Q2 FY27 revenue of Rs 1,592.5 crore, up 103.9% year-on-year, in a quarter that included 82 days of TruBridge consolidation, while adjusted EBITDA margin declined to 28.8% from 36.0%. IKS therefore added substantial reported revenue and adjusted EBITDA, but the increase in revenue exceeded the increase in earnings.
Know Inventurus Knowledge Solutions inside out
Results, valuation, peers and who's buying, in one view.
How did TruBridge consolidation affect IKS revenue in Q2 FY27?
IKS recorded Rs 1,592.5 crore of revenue from operations in Q2 FY27, compared with Rs 781.1 crore in Q2 FY26 and Rs 893.6 crore in Q1 FY27. The presentation identifies Q2 FY27 as containing 82 days of TruBridge consolidation. Revenue rose 103.9% year-on-year and 78.2% quarter-on-quarter, while revenue in US dollars was USD 169 million, up 87.3% year-on-year.
The revenue increase put Q2 FY27 above the combined scale of the prior-year comparison period, while H1 FY27 revenue reached Rs 2,486.1 crore, up 63.4% from Rs 1,521.2 crore in H1 FY26. The lower first-half growth rate reflects Q1 FY27 revenue of Rs 893.6 crore, before the Q2 FY27 increase to Rs 1,592.5 crore. The source presents the 82-day consolidation specifically for Q2 FY27.
IKS also reported more than 450 enterprise-level customers in Q2 FY27. Its top 10 customers generated Rs 341.8 crore of revenue, while the average customer vintage was 5.99 years for the top 10 clients and 7.61 years for the top five. Those figures indicate that revenue included contributions from established client relationships alongside the newly consolidated operations.
Why did IKS adjusted EBITDA margin fall to 28.8%?
IKS adjusted EBITDA margin declined to 28.8% in Q2 FY27 from 36.0% in Q2 FY26 and 35.4% in Q1 FY27. Adjusted EBITDA was Rs 459.1 crore, up 63.2% year-on-year and 45.0% quarter-on-quarter from Rs 316.7 crore. Adjusted EBITDA is EBITDA adjusted for employee stock option plan, or ESOP, expense.
The margin movement was a 7.2-percentage-point year-on-year decline and a 6.6-percentage-point sequential decline. Revenue grew 103.9% year-on-year, faster than adjusted EBITDA growth of 63.2%, producing the lower margin. For H1 FY27, adjusted EBITDA was Rs 775.8 crore and the margin was 31.2%, compared with 34.7% in H1 FY26.
Employee benefit expense excluding ESOP rose 97.8% year-on-year to Rs 786.1 crore in Q2 FY27, while other expenses rose 196.6% to Rs 355.9 crore. The presentation states that other expenses include acquisition expenses incurred in the current and preceding quarter. It does not quantify a standalone TruBridge margin or assign a separate amount of the margin change to each expense category.
Reported EBITDA was Rs 441.5 crore in Q2 FY27, up 62.5% year-on-year, and its margin was 27.7%, versus 34.8% in Q2 FY26. ESOP cost was Rs 17.6 crore, up 83.1% year-on-year from Rs 9.6 crore. As a result, the reported EBITDA margin fell by 7.1 percentage points, broadly matching the decline in the adjusted measure.
Did higher revenue translate into higher profit for IKS?
IKS reported profit attributable to shareholders of Rs 217.6 crore in Q2 FY27, up 20.4% year-on-year from Rs 180.7 crore and 12.3% from Rs 193.7 crore in Q1 FY27. Profit before tax, or PBT, was Rs 273.2 crore, up 19.2% year-on-year. The profit attributable margin was 13.67%, compared with 23.14% in Q2 FY26.
Adjusted profit for the period reached Rs 273.4 crore, up 36.0% year-on-year from Rs 201.1 crore. IKS adjusts this measure for acquisition-related intangible-asset amortisation and ESOP cost, both net of tax. In Q2 FY27, amortisation of intangible assets net of tax was Rs 42.4 crore and ESOP cost net of tax was Rs 13.4 crore.
Finance cost increased to Rs 101.9 crore in Q2 FY27 from Rs 16.1 crore in Q2 FY26 and Rs 10.1 crore in Q1 FY27. Depreciation and amortisation increased 197.9% year-on-year to Rs 89.8 crore. Earnings per share rose to Rs 13.0 from Rs 10.8 a year earlier, while return on equity was 27.2%, compared with 34.4%; IKS attributed the year-on-year decline partly to a higher equity base following the revaluation of Abridge, lower currency gains and one-time acquisition costs.
Got a follow-up? Ask IRIS
What happened to IKS cash flow and net debt?
IKS generated operating cash flow of Rs 393.4 crore in Q2 FY27, up 35.4% from Rs 290.5 crore in Q2 FY26. Free cash flow was Rs 262.1 crore, up 16.6% from Rs 224.8 crore. The difference in growth rates means free cash flow increased more slowly than operating cash flow during the quarter.
The presentation says free cash flow was affected by tax payments higher than the tax charge during Q2 FY27, which IKS expects to recover against future tax obligations. Quarterly cash flow was also affected by Rs 96 crore of acquisition expenses incurred by TruBridge before the acquisition, for which IKS acquired the liability and made payment after acquisition.
Net debt was Rs 5,280.8 crore at 30 September 2026, compared with Rs 265.4 crore at 30 June 2026 and Rs 412.5 crore at 30 September 2025. The presentation provides these dates and balances but does not provide a bridge separating acquisition funding, acquired liabilities and other factors behind the movement in net debt.
How is IKS planning to work with TruBridge clients?
IKS identified claims denials, coding and clinical efficiency as its initial focus areas for TruBridge clients. Its denial-prediction tool uses artificial intelligence, or AI, to identify claim-denial risk before submission. Its coding suite combines AI-assisted coding, human validation and pre-bill compliance review, while the clinical-efficiency offering combines a virtual care assistant with IKS Scribble for document management and clinical documentation.
The client rollout disclosed by IKS includes MyCareHub implementation at OrthoNY for Evolve Orthopedic Partners. At Augusta Health, a proposed coverage-verification expansion would add ongoing revenue-cycle-management support to work involving electronic medical record workflows. These are disclosed operating plans rather than quantified revenue or margin targets.
IKS also described a data-migration partnership with UMass Memorial Health that is expanding from the Milford Regional integration to the parent enterprise. TruBridge has partnered with MISH Hospital and Clinics on a unified electronic health record platform. The presentation does not disclose contract values, expected timing for revenue recognition or financial targets for these deployments.
Conclusion
Q2 FY27 shows the immediate reported scale of the TruBridge consolidation: revenue reached Rs 1,592.5 crore after 82 days of consolidation, while adjusted EBITDA rose to Rs 459.1 crore. Margin and profit growth did not match revenue growth, with adjusted EBITDA margin declining 7.2 percentage points year-on-year to 28.8% and profit attributable to shareholders rising 20.4% to Rs 217.6 crore.
The next items to watch are IKS's planned deployment of denial, coding and clinical-efficiency products for TruBridge clients, including the underway MyCareHub rollout at OrthoNY and the proposed Augusta Health expansion. Cash conversion and net debt also remain measurable follow-through points after Q2 FY27 operating cash flow of Rs 393.4 crore, free cash flow of Rs 262.1 crore and net debt of Rs 5,280.8 crore at 30 September 2026.