










The Investment Trust of India Q2 profit falls 76% in FY27
Key highlights
- ITI reported Q2 FY27 consolidated revenue of Rs 52.61 crore, down 33.46% year-on-year.
- Consolidated PAT fell 76.11% year-on-year to Rs 1.34 crore in Q2 FY27.
- Financing profit moved to negative Rs 0.95 crore from positive Rs 5.24 crore a year earlier.
- ITI's standalone loss widened to Rs 1.29 crore from Rs 0.32 crore in Q2 FY26.
powered by IRIS
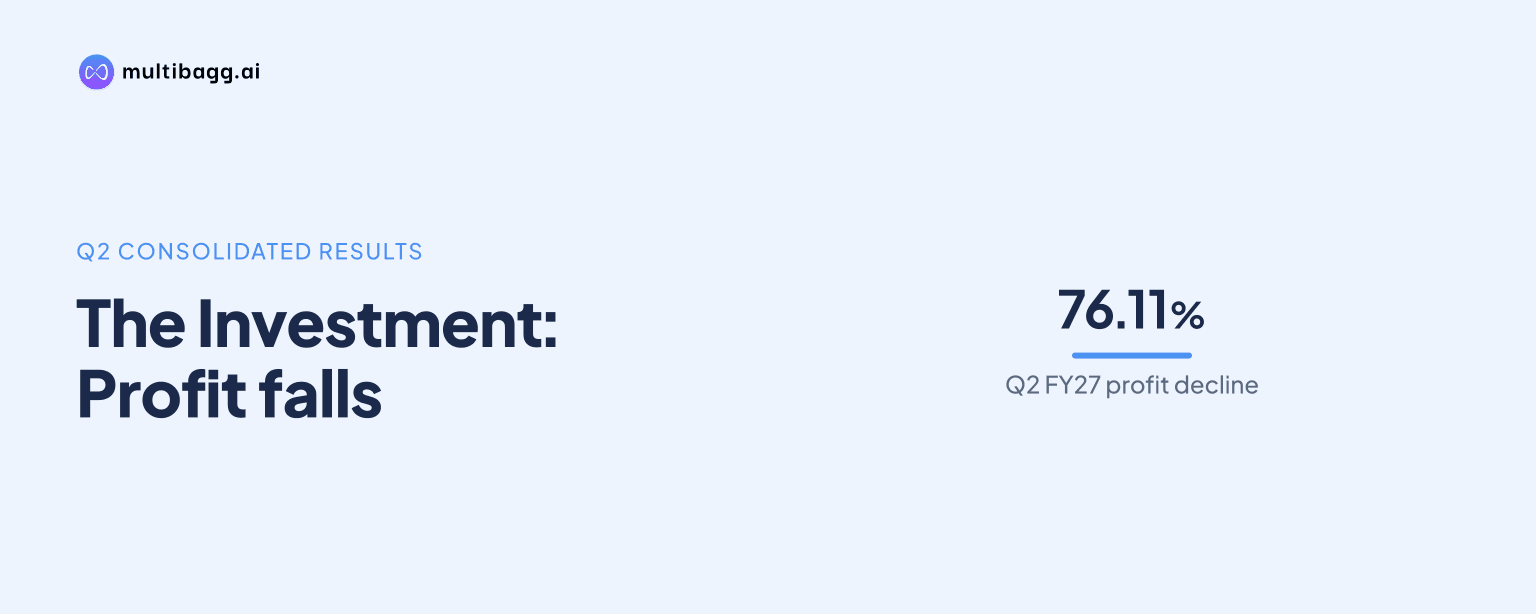
The Investment Trust of India Limited reported consolidated net profit of Rs 1.34 crore for the quarter ended September 30, 2026, a 76.11% year-on-year decline from Rs 5.61 crore, while consolidated revenue fell 33.46% to Rs 52.61 crore. The Q2 FY27 result points to a weaker operating quarter for ITI after a higher-profit first quarter.
Know The Investment Trust of India inside out
Results, valuation, peers and who's buying, in one view.
What did ITI report for Q2 FY27?
ITI reported consolidated revenue of Rs 52.61 crore in Q2 FY27, compared with Rs 79.06 crore in Q2 FY26. The decline of Rs 26.45 crore translated into a 33.46% year-on-year fall in revenue for the July to September period.
Consolidated profit after tax, or PAT, stood at Rs 1.34 crore, against Rs 5.61 crore a year earlier. On a more granular basis, the company reported financing profit of negative Rs 0.95 crore, compared with a profit of Rs 5.24 crore in Q2 FY26. This represented a year-on-year deterioration of 118.13% in financing profit.
The results were approved at the board meeting held on November 4, 2026. The company had informed the exchanges on October 27 that its board would consider unaudited standalone and consolidated financial results for the quarter and half year ended September 30, 2026.
How did the September quarter compare with last year?
The September-quarter comparison shows declines in both consolidated revenue and profit. Revenue decreased from Rs 79.06 crore in Q2 FY26 to Rs 52.61 crore in Q2 FY27, while consolidated PAT reduced from Rs 5.61 crore to Rs 1.34 crore.
The standalone result was weaker than the consolidated outcome. The standalone entity recorded a loss after tax of Rs 1.29 crore in Q2 FY27, compared with a loss of Rs 0.32 crore in the corresponding quarter of the previous year. The standalone loss therefore widened by Rs 0.97 crore year-on-year.
How does Q2 FY27 compare with ITI's first quarter?
ITI's Q2 FY27 consolidated revenue of Rs 52.61 crore was lower than the Rs 59.36 crore reported in Q1 FY27. Consolidated PAT also fell from Rs 12.38 crore in the June 2026 quarter to Rs 1.34 crore in the September 2026 quarter.
The Q1 FY27 profit had risen 21.3% year-on-year, although Q1 revenue was down 15.3% from the previous year. The reported Q1 performance was supported by associate gains, according to the available result summary. That context is relevant when comparing the sequential change in reported quarterly profit, though the Q2 disclosure provides no specific explanation for the quarter-on-quarter decline.
ITI's Q1 segment data had shown asset management revenue rising 33.6% year-on-year to Rs 17.55 crore and investment and advisory revenue increasing 63.6% to Rs 11.01 crore. Broking and related services, identified as the largest segment, reported revenue of Rs 35.89 crore in Q1, down 2.0% year-on-year.
Got a follow-up? Ask IRIS
What should investors note about comparability and business context?
Investors should note ITI's disclosure that ITI Gold Loans Ltd became an equity-accounted associate rather than a consolidated subsidiary effective November 30, 2025. The company had stated in its Q1 FY27 notes that current-period figures were not directly comparable with the year-ago period because of this accounting change.
ITI, incorporated in 1991, provides advisory services and trading activities. Its reported financial performance can also reflect developments across broking and related services, asset management, investment and advisory, financing operations, and associate accounting. The Q2 figures show that the financing line moved into a loss while consolidated revenue and PAT were both lower year-on-year.
For shareholders, the key reported outcome is the reduction in consolidated profitability despite the company remaining profitable at the consolidated level. No share-price movement, dividend decision, or management outlook was provided in the supplied results information, so the reported financial data remains the clearest basis for assessing the quarter.
How did the result affect the financial picture?
The Q2 result reduced ITI's consolidated PAT to Rs 1.34 crore, following Rs 12.38 crore in Q1 FY27. Revenue was also lower sequentially, declining by Rs 6.75 crore from the June quarter. These movements indicate a substantially lower reported contribution in the September quarter than in the preceding quarter.
The widening standalone loss and negative financing profit add to the weaker consolidated comparison. At the same time, the available information does not identify a specific operational trigger, customer impact, or market event behind the Q2 changes. Investors therefore need to distinguish between reported figures and explanations that have not been disclosed in the supplied material.
Conclusion
ITI's Q2 FY27 consolidated results showed revenue of Rs 52.61 crore and PAT of Rs 1.34 crore, down 33.46% and 76.11% respectively from a year earlier. The quarter also included a negative financing profit and a wider standalone loss, while the company's accounting treatment of ITI Gold Loans Ltd remains relevant to period-to-period comparisons.
The next disclosure to watch is ITI's subsequent quarterly financial update, particularly for any details on the financing business, the performance of broking, asset management and advisory operations, and the effect of associate accounting on consolidated numbers. Any further company commentary on the reasons for the Q2 movement will also be material for investors assessing the trend.