










Ion Exchange profitability declined to an H1 FY27 net loss
Key highlights
- Ion Exchange’s consolidated operating EBITDA margin declined from 12.82% in FY23 to negative 3.85% in H1-FY27.
- Ion Exchange reported a Rs 79.7 crore consolidated PAT loss in H1-FY27, versus Rs 143.2 crore profit in FY26.
- Ion Exchange’s ROCE fell from 30.0% in FY23 to 14.3% in FY26, while ROE fell from 23.3% to 11.2%.
- Ion Exchange’s working-capital days were 91 in FY26, after 99 in FY24 and 94 in FY25.
powered by IRIS
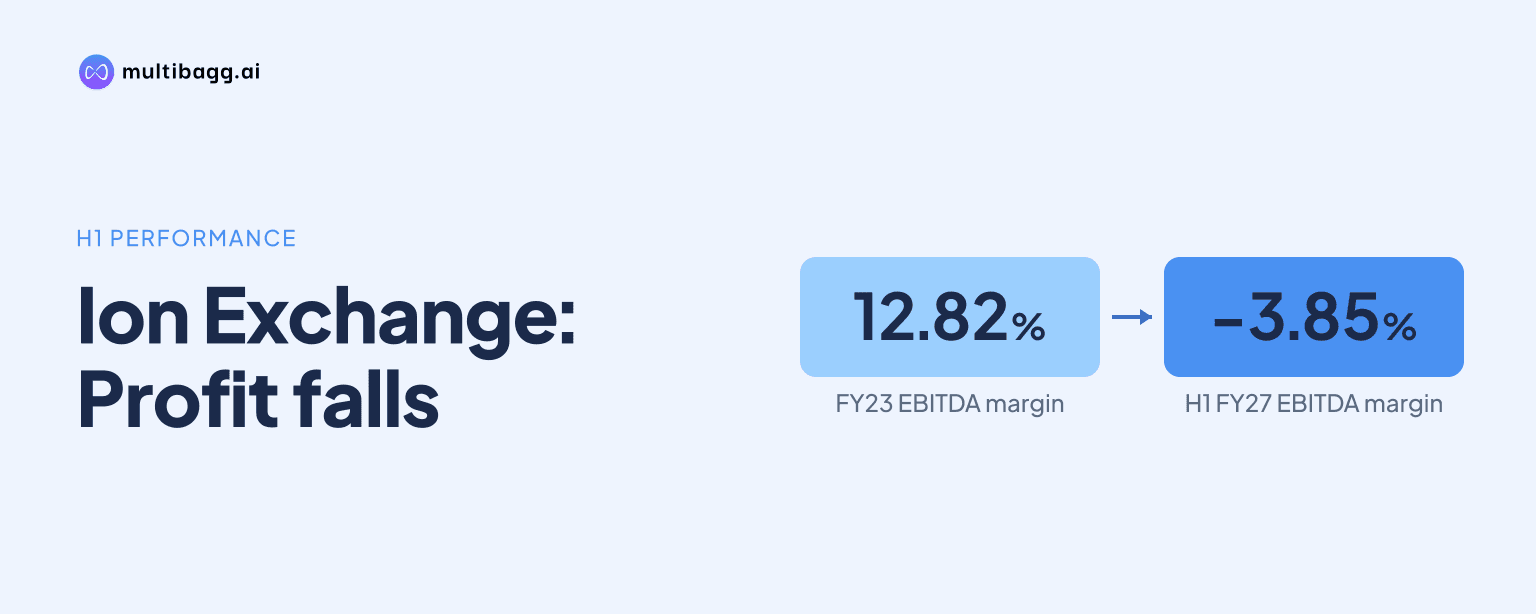
Ion Exchange (India) Limited moved from a 12.82% consolidated operating EBITDA margin in FY23 to a negative 3.85% margin in H1-FY27, while profit after tax became a Rs 79.7 crore loss. The presentation links reduced profitability to Roha plant capital expenditure and says the West Asia crisis affected gross working capital.
Know Ion Exchange (India) inside out
Results, valuation, peers and who's buying, in one view.
How far did Ion Exchange’s profit margins fall?
Ion Exchange’s consolidated operating EBITDA margin declined in every reported full year from FY23 to FY26 before turning negative in H1-FY27. Operating income increased from Rs 1,989.6 crore in FY23 to Rs 2,914.8 crore in FY26, but operating earnings before interest, tax, depreciation and amortisation, or EBITDA, did not keep pace. Operating EBITDA rose from Rs 255 crore in FY23 to Rs 293.9 crore in FY25, then fell to Rs 210.2 crore in FY26, reducing the margin from 12.82% to 7.21%.
The H1-FY27 result marked a further break in the earnings trend. Operating income was Rs 1,375.2 crore for the half year, while expenses were Rs 1,428.2 crore, resulting in negative operating EBITDA of Rs 53 crore and a negative 3.85% margin. H1-FY27 is a partial period and is therefore not directly comparable with full-year results, but it shows costs exceeding operating income during the reported six months.
Ion Exchange’s profit after tax, or PAT, followed the margin contraction. PAT was Rs 195 crore in FY23, Rs 195.4 crore in FY24 and Rs 208.3 crore in FY25, before declining to Rs 143.2 crore in FY26. The PAT margin fell each year, from 9.80% in FY23 to 4.91% in FY26, and became negative 5.80% in H1-FY27 with a Rs 79.7 crore loss.
Why did Ion Exchange report a loss in H1 FY27?
Ion Exchange reported the H1-FY27 loss after a negative Rs 53 crore operating EBITDA result was compounded by Rs 43.8 crore of depreciation and Rs 18.4 crore of finance cost. Other income was Rs 13.8 crore, and the share of profit from an equity-accounted investee was Rs 1.3 crore. These items resulted in a loss before tax of Rs 101.4 crore; a tax credit of Rs 20.4 crore reduced the reported PAT loss to Rs 79.7 crore.
Management’s presentation identifies the impact of Roha plant capital expenditure, reduced profitability and the West Asia crisis’ impact on gross working capital in its summary of the historical trend. It does not quantify the separate earnings effect of each factor. The financial statements nevertheless show depreciation increasing from Rs 44.5 crore in FY25 to Rs 62.6 crore in FY26, while finance cost increased from Rs 13.5 crore to Rs 24 crore over the same period.
The FY26 fall occurred despite a Rs 177.7 crore increase in operating income from FY25. Expenses rose by Rs 261.4 crore to Rs 2,704.6 crore, exceeding the revenue increase and reducing operating EBITDA by Rs 83.7 crore. In H1-FY27, Ion Exchange recorded Rs 13.8 crore of other income, compared with Rs 86.5 crore in FY26, although differences in reporting periods mean that comparison is directional rather than like-for-like.
Got a follow-up? Ask IRIS
How did Ion Exchange’s returns on capital and equity change?
Ion Exchange’s return on capital employed, or ROCE, decreased from 30.0% in FY23 to 14.3% in FY26, while return on equity, or ROE, declined from 23.3% to 11.2%. The presentation defines ROCE as earnings before interest and tax divided by capital employed, and ROE as net profit divided by net worth. Both measures fell in each of the four reported full years.
The presentation does not provide H1-FY27 return ratios, so no half-year return conclusion can be drawn from its reported table. However, consolidated property, plant and equipment increased from Rs 328 crore in FY25 to Rs 685.3 crore in FY26, while capital work-in-progress was Rs 174.7 crore in FY26. At H1-FY27, property, plant and equipment stood at Rs 664.4 crore and capital work-in-progress at Rs 242.5 crore, showing the continuing balance-sheet weight of the capital programme.
Consolidated total equity increased from Rs 1,209.5 crore in FY25 to Rs 1,340.3 crore in FY26, then fell to Rs 1,246.5 crore at H1-FY27. The decline in equity in the half year coincided with the Rs 79.7 crore PAT loss. Net debt to equity moved from negative 0.6 in FY23 to 0.1 in FY26 and remained 0.1 in H1-FY27, according to the presentation.
What happened to Ion Exchange’s working capital?
Ion Exchange reported working-capital days of 91 in FY23, 99 in FY24, 94 in FY25 and 91 in FY26. The measure therefore returned to its FY23 level by FY26 after rising eight days in FY24. Management says the Treatment Solution segment has a high proportion in working capital and cites the West Asia crisis as an FY26 influence.
At the consolidated balance-sheet level, trade receivables reduced from Rs 1,074.7 crore in FY26 to Rs 1,057.3 crore at H1-FY27, while inventory decreased from Rs 441.4 crore to Rs 433.1 crore. Other current assets increased from Rs 504.6 crore to Rs 530.9 crore. Total current assets declined by Rs 34.3 crore to Rs 2,322.4 crore, while current liabilities rose by Rs 159.1 crore to Rs 1,772.5 crore.
Management’s disclosed future actions include increasing business from Industrial Products, Lifecycle Services and Specialty Chemicals, increasing the share of international business and focusing on improvement in the working-capital cycle. It also states that it will continue disciplined capital allocation. These are management plans, rather than quantified financial targets or forecasts in the presentation.
Conclusion
Ion Exchange’s historical data show a sustained deterioration in profitability before the H1-FY27 loss: consolidated EBITDA margin fell from 12.82% in FY23 to 7.21% in FY26, PAT margin declined from 9.80% to 4.91%, and ROCE and ROE fell to 14.3% and 11.2%. Revenue increased through FY26, but expenses, depreciation and finance cost rose as profitability narrowed.
The next reported periods will show whether management’s planned higher mix of Industrial Products, Lifecycle Services, Specialty Chemicals and international business changes the margin pattern. Investors can also watch working-capital days, the H1-FY27 Rs 242.5 crore capital work-in-progress balance, and whether the focus on disciplined capital allocation accompanies a recovery in returns.