










BLS Polymers’ Others Portfolio Drove Growth as PE Sales Declined
Key highlights
- BLS Polymers’ product sales rose 8.6% to Rs 349.428 crore in FY26 from Rs 296.358 crore in FY24.
- The Others category increased 62.3% to Rs 111.224 crore in FY26, adding Rs 68.997 crore—more than the company-wide Rs 53.070 crore increase.
- The PE-labelled group declined 3.9% to Rs 184.174 crore, while XLPE fell 1.2% to Rs 48.910 crore between FY24 and FY26.
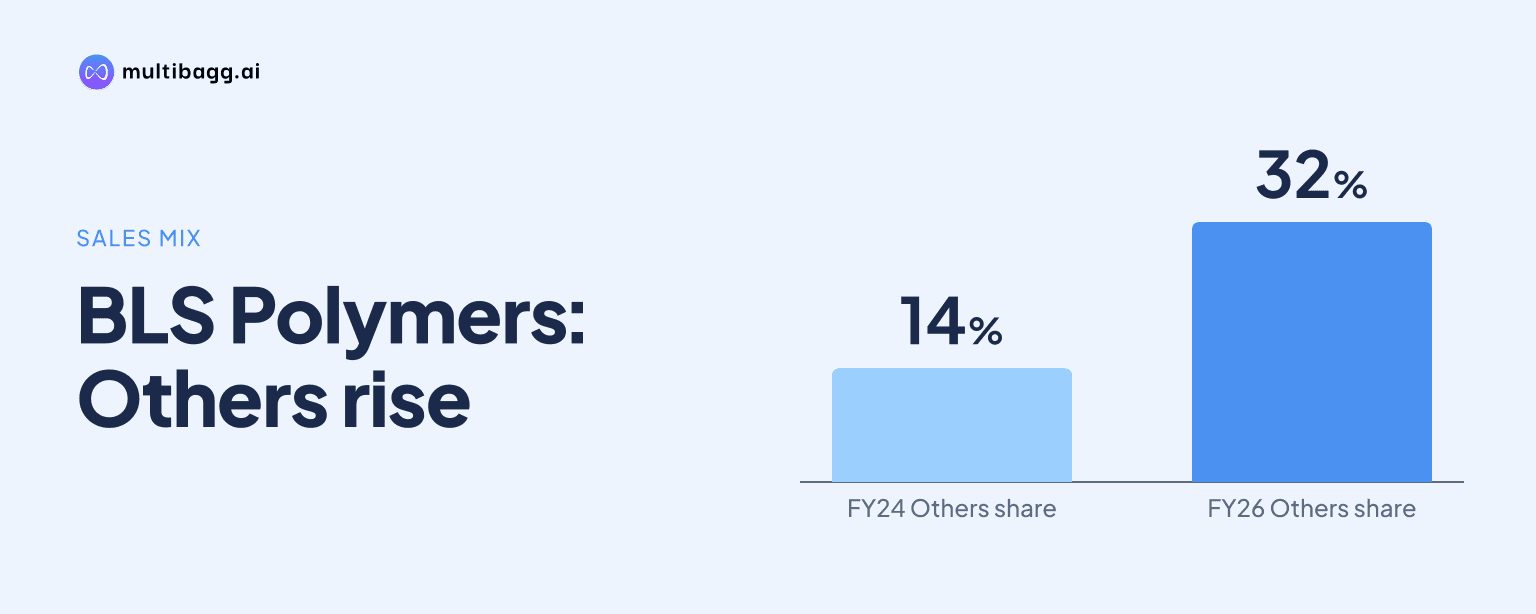
- Others’ share of sales more than doubled from about 14% in FY24 to about 32% in FY26, while the PE-labelled group’s share fell from about 67% to about 53%.
powered by IRIS
BLS Polymers increased product sales by 8.6% from Rs 296.358 crore in fiscal year (FY) 2024 to Rs 349.428 crore in FY26, but the increase came overwhelmingly from its unspecified Others category. Others added Rs 68.997 crore, exceeding the total Rs 53.070 crore sales increase while the polyethylene (PE)-labelled group and cross-linked polyethylene (XLPE) declined.
Why did BLS Polymers’ growth depend on the Others portfolio?
BLS Polymers’ reported growth depended on Others because that category grew 62.3%, from Rs 42.227 crore in FY24 to Rs 111.224 crore in FY26. The product-wise sales disclosure does not identify the products included in Others, although BLS Polymers separately describes a broader portfolio including polymer compounds, cable filling compounds, masterbatches and adhesive coating compounds.
The arithmetic shows the concentration of incremental sales. Total sales rose by Rs 53.070 crore between FY24 and FY26, while Others increased by Rs 68.997 crore, meaning declines in other categories partly offset its expansion. The PE-labelled grouping fell by Rs 15.181 crore and XLPE fell by Rs 1.226 crore; polyvinyl chloride (PVC) added only Rs 0.479 crore.
The reported PE-labelled group combines high-density polyethylene, medium-density polyethylene, linear low-density polyethylene, cable filling compounds, halogen-free compounds, masterbatches and polypropylene. Since this grouping declined 3.9% despite being BLS Polymers’ largest category, the FY24-to-FY26 result reflects expansion outside the explicitly reported core grouping rather than growth across all major product lines.
Which BLS Polymers segments lost share between FY24 and FY26?
BLS Polymers’ PE-labelled group lost the most sales share, declining from about 67% of total sales in FY24 to about 53% in FY26. Its sales decreased from Rs 199.355 crore to Rs 184.174 crore, even as total sales increased by Rs 53.070 crore during the same two fiscal years.
XLPE also contracted, although less sharply, with sales moving from Rs 50.136 crore in FY24 to Rs 48.910 crore in FY26. XLPE sales first rose to Rs 52.877 crore in FY25 before declining in FY26, so the two-year decrease of 1.2% includes a reversal after FY25.
The combined PE-labelled group and XLPE categories accounted for Rs 249.491 crore, or about 84% of FY24 sales. By FY26, their combined sales were Rs 233.084 crore, or about 67% of the Rs 349.428 crore total. This 17-percentage-point shift reduced dependence on those two categories, although they still generated about two-thirds of FY26 sales.
PVC was the only named category besides Others to increase over the two years, rising 5.0% from Rs 4.641 crore to Rs 5.120 crore. Its scale remained about 1.5% of FY26 sales, so PVC did not materially change the result that Others supplied reported growth while the two larger named categories contracted.
Got a follow-up? Ask IRIS
How did the BLS Polymers sales mix change by FY26?
BLS Polymers’ sales mix shifted toward Others, whose share more than doubled from about 14% in FY24 to about 32% in FY26. The Rs 111.224 crore FY26 Others figure made it the second-largest reported category, behind the Rs 184.174 crore PE-labelled group and ahead of Rs 48.910 crore XLPE.
The change occurred across two annual steps. Others sales nearly doubled to Rs 84.799 crore in FY25 from Rs 42.227 crore in FY24, then increased again to Rs 111.224 crore in FY26. Total sales rose from Rs 296.358 crore to Rs 328.433 crore in FY25 and Rs 349.428 crore in FY26, while the PE-labelled group declined in both years, from Rs 199.355 crore to Rs 186.411 crore and then Rs 184.174 crore.
This mix change cannot establish which individual products or customers drove the Others increase because the disclosed sales table provides no further category definition. For the FY24-to-FY26 growth pattern to persist, Others sales would need to expand sufficiently to offset any further decline in the PE-labelled group and XLPE.
What operating factors could affect BLS Polymers’ future mix?
BLS Polymers reported FY26 net annual production capacity of 35,251 metric tonnes after applying a 90% availability factor and an 85% performance-efficiency factor to installed capacity. The capacity schedule lists 2,310 metric tonnes per month for PE, 630 for XLPE and 540 for PVC before the stated adjustments, while one masterbatch machine is designated for internal consumption when required.
Customer continuity is another disclosed factor. Customers associated with BLS Polymers for more than five years contributed 61.34% of product-sale revenue in FY24, 45.67% in FY25 and 39.52% in FY26. BLS Polymers’ stated plan is to increase wallet share from existing domestic customers by broadening its product portfolio, increasing engagement and investing in manufacturing infrastructure.
Exports provide a further, but smaller, sales channel. BLS Polymers reported export revenue of Rs 19.1 crore in FY26, down from Rs 28.1 crore in FY25; exports represented 5.5% of FY26 revenue from operations compared with 8.5% in FY25. BLS Polymers aims to increase international demand, while identifying import duties, customs procedures, technical standards, certification requirements and localisation policies as risks in export markets.
The first-quarter (Q1) FY27 product-sales figure was Rs 107.026 crore, comprising Rs 72.654 crore for the PE-labelled group, Rs 13.692 crore for XLPE, Rs 1.710 crore for PVC and Rs 18.970 crore for Others. As a single quarter, this disclosure cannot determine the full-year mix, but it shows that PE remained the largest reported category despite its two-year decline through FY26.
Conclusion
BLS Polymers’ 8.6% sales growth between FY24 and FY26 was a revenue-mix outcome rather than growth in its two largest named product lines. Others increased by Rs 68.997 crore, more than the company-wide Rs 53.070 crore increase, while the PE-labelled group and XLPE together declined by Rs 16.407 crore and their combined share fell from about 84% to about 67%.
The next issue to watch is execution of BLS Polymers’ plan to broaden products sold to existing domestic customers, whose over-five-year cohort accounted for 39.52% of FY26 product-sale revenue. The unresolved matter is the composition of Others: the FY26 figure of Rs 111.224 crore explains the growth, but the available product-sales disclosure does not specify the products, margins, customers or end-markets within that category.