










Shree Siddhivinayak margins rise as liquidity stays tight
Key highlights
- Shree Siddhivinayak’s revenue from operations increased to Rs 75.2677 crore in FY 2026 from Rs 36.2764 crore in FY 2024.
- Shree Siddhivinayak’s PAT margin rose to 15.40% in FY 2026 from 8.49% in FY 2024.
- Shree Siddhivinayak’s current ratio was 0.90 times in FY 2026, below 1.00 times for the third consecutive year.
- Shree Siddhivinayak reported debt of Rs 89.9537 crore and a debt-equity ratio of 3.59 times in FY 2026.
powered by IRIS
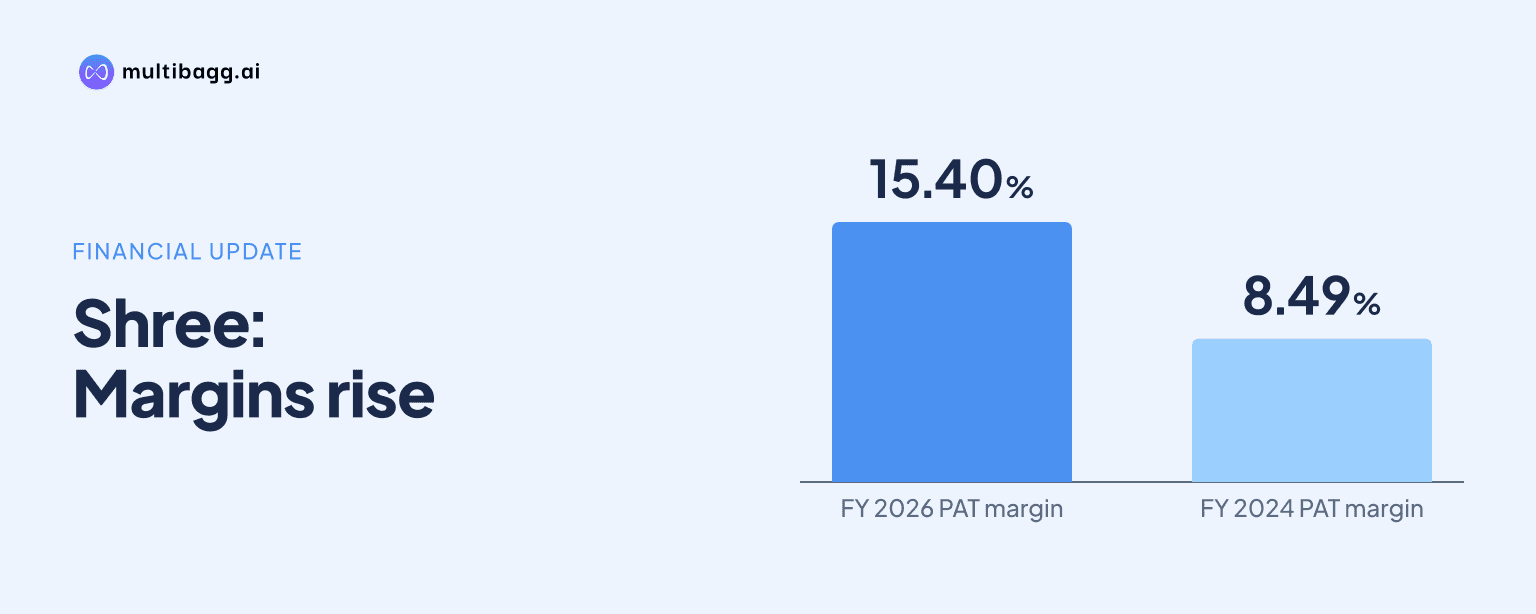
Shree Siddhivinayak Greentech Industries Limited increased its profit after tax margin to 15.40% in FY 2026 from 8.49% in FY 2024, while its current ratio remained below one at 0.90 times and debt-equity stood at 3.59 times. The figures show faster earnings growth alongside continuing dependence on current liabilities and borrowings.
How did Shree Siddhivinayak’s profit margins expand?
Shree Siddhivinayak expanded both operating and net margins during its first three reported operating years as revenue from operations rose from Rs 36.2764 crore in FY 2024 to Rs 75.2677 crore in FY 2026. The company commenced commercial operations in FY 2023-24, making FY 2024, FY 2025 and FY 2026 its post-commencement operating period. Revenue grew 61.44% in FY 2025 and a further 28.52% in FY 2026.
Earnings before interest, tax, depreciation and amortisation, or EBITDA, increased from Rs 8.6130 crore in FY 2024 to Rs 20.4622 crore in FY 2026. EBITDA margin, which the company defines as EBITDA divided by total operating income, increased by 3.45 percentage points from 23.74% to 27.19%. Shree Siddhivinayak attributes the progression to operating leverage, cost absorption and cost management as operations expanded.
Profit after tax, or PAT, rose from Rs 3.0813 crore in FY 2024 to Rs 5.4966 crore in FY 2025 and Rs 11.5922 crore in FY 2026. FY 2026 PAT was 110.90% higher than FY 2025, exceeding the 78.39% growth reported in FY 2025. PAT margin reached 15.40% in FY 2026 from 9.39% a year earlier, a 6.01-percentage-point increase that exceeded the three-year EBITDA-margin expansion.
What does Shree Siddhivinayak’s 0.90 current ratio mean?
Shree Siddhivinayak’s current ratio of 0.90 times in FY 2026 means its reported current assets were lower than its current liabilities at the reporting date. The company defines the current ratio as current assets divided by current liabilities. It improved modestly from 0.87 times in FY 2024 and 0.88 times in FY 2025, but remained below 1.00 times throughout the three-year period.
The sub-one ratio matters because Shree Siddhivinayak identifies continuing reliance on short-term liabilities to finance working capital. The position persisted even as net worth increased from Rs 12.9813 crore in FY 2024 to Rs 25.0701 crore in FY 2026. A sustained change in liquidity coverage would require current assets to rise relative to current liabilities, rather than an increase in shareholders’ funds alone.
The FY 2026 peer table places Shree Siddhivinayak’s 0.90-times current ratio below the 3.07 times reported for Dhampur Specialty Sugars Limited and 1.69 times for Dollex Agrotech Limited. These are reported comparative ratios rather than identical business models, but the table shows that Shree Siddhivinayak had the lowest current-asset coverage of current liabilities among the three companies.
Got a follow-up? Ask IRIS
How much leverage did Shree Siddhivinayak carry in FY 2026?
Shree Siddhivinayak reported debt of Rs 89.9537 crore and a debt-equity ratio of 3.59 times in FY 2026. Debt-equity is defined as debt divided by equity, while reported net worth was Rs 25.0701 crore. The ratio declined from 5.89 times in FY 2024 and 3.94 times in FY 2025 as net worth increased over the period.
Debt did not decline continuously as the debt-equity ratio improved. Borrowings moved from Rs 76.4526 crore in FY 2024 to Rs 72.7558 crore in FY 2025, before increasing by Rs 17.1979 crore to Rs 89.9537 crore in FY 2026. The lower ratio therefore reflects growth in net worth relative to debt, while the absolute FY 2026 debt balance was higher than in either prior year.
Debt-servicing coverage improved during the same period. Interest coverage, defined as earnings before interest and tax divided by interest, rose from 1.88 times in FY 2024 and 1.98 times in FY 2025 to 3.70 times in FY 2026. The FY 2026 peer table reports interest coverage of 351.62 times for Dhampur Specialty Sugars and 3.87 times for Dollex Agrotech, while Shree Siddhivinayak’s 3.59-times debt-equity ratio compares with 0.00 and 1.27 times, respectively.
How did working capital affect Shree Siddhivinayak cash flow?
Shree Siddhivinayak generated operating cash flow of Rs 5.0419 crore in FY 2026, compared with Rs 13.2417 crore in FY 2025 and an operating cash outflow of Rs 17.7864 crore in FY 2024. The move from negative to positive operating cash flow followed the FY 2024 outflow, but FY 2026 cash flow did not rise in line with PAT of Rs 11.5922 crore.
Inventory days declined to 117 in FY 2026 from 147 in FY 2025, but remained above the one day reported in FY 2024. Trade payable days fell from 256 in FY 2025 to 150 in FY 2026, while trade receivable days were zero in FY 2026 compared with eight days in FY 2025. Lower inventory days can reduce cash held in stock, while fewer payable days can require faster settlement of supplier obligations.
Shree Siddhivinayak sells jaggery powder and khandsari sugar in bulk to business-to-business customers, alongside consumer packs and pre-mixes under the FeelGuddy brand. It began manufacturing khandsari sugar and entered sugarcane-seed cultivation and sales in FY 2025-26. These additions coincided with inventory of 117 days in FY 2026, making working-capital execution material to the conversion of reported profit into operating cash flow.
Conclusion
Shree Siddhivinayak’s FY 2024 to FY 2026 performance combined rapid revenue growth with higher profitability: revenue increased to Rs 75.2677 crore, EBITDA margin reached 27.19%, and PAT margin reached 15.40%. However, the 0.90-times current ratio, debt of Rs 89.9537 crore and 3.59-times debt-equity ratio show that higher earnings have not removed reliance on current liabilities and borrowings.
The disclosed focus on liquidity management, working-capital optimisation and gradual deleveraging makes inventory days, operating cash flow and debt central unresolved measures. Investors can watch whether inventory days fall below 117, operating cash flow recovers from Rs 5.0419 crore and the current ratio rises above the sub-one level reported in FY 2026.