










J. Kumar Q2 profit rises 25% as net margin reaches 7.4%
Key highlights
- J. Kumar’s Q2FY27 PAT rose 25% year on year to Rs 113 crore.
- J. Kumar’s Q2FY27 revenue increased 15% to Rs 1,539 crore.
- J. Kumar’s Q2FY27 PAT margin rose to 7.4% from 6.7%.
- J. Kumar reported H1FY27 net cash used in operating activities of Rs 18 crore.
powered by IRIS
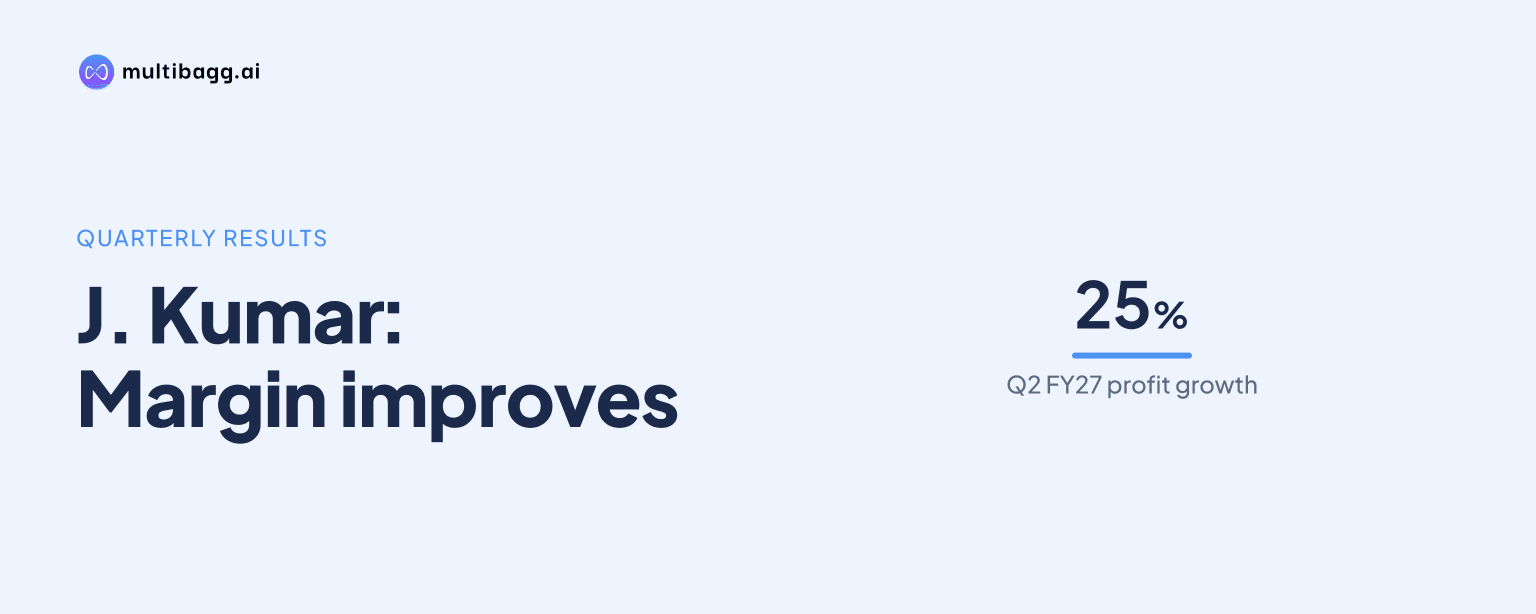
J. Kumar Infraprojects Ltd reported Q2FY27 profit after tax (PAT) of Rs 113 crore, up 25% year on year, as revenue rose 15% to Rs 1,539 crore and PAT margin reached 7.4% from 6.7%. Consolidated earnings before interest, tax, depreciation and amortisation (EBITDA) and earnings before interest and tax (EBIT) each rose 18%.
Know J Kumar Infraprojects inside out
Results, valuation, peers and who's buying, in one view.
How did J. Kumar perform in Q2FY27?
J. Kumar increased Q2FY27 revenue from operations by 15% year on year to Rs 1,539 crore, from Rs 1,343 crore in Q2FY26. EBITDA rose 18% to Rs 229 crore from Rs 195 crore, while EBIT also increased 18% to Rs 194 crore from Rs 165 crore.
J. Kumar’s profit before tax (PBT) rose 21% to Rs 151 crore in Q2FY27, compared with Rs 124 crore a year earlier. Finance cost increased to Rs 43 crore from Rs 41 crore, depreciation rose to Rs 47 crore from Rs 42 crore, and other income declined to Rs 12 crore from Rs 13 crore.
J. Kumar recorded Q2FY27 cash PAT of Rs 160 crore, up 21% from Rs 133 crore in Q2FY26. The company also reported a Rs 1 crore share in profit of an associate, net of taxes, compared with zero in the prior-year quarter, while tax expense was Rs 38 crore against Rs 34 crore.
What changed in J. Kumar’s quarterly margins?
J. Kumar expanded its Q2FY27 EBITDA margin to 14.9%, from 14.5% in Q2FY26, a 40-basis-point increase. EBIT margin rose to 12.6% from 12.3%, while PBT margin increased to 9.8% from 9.2%; one basis point equals one-hundredth of a percentage point.
J. Kumar’s PAT margin increased by 70 basis points to 7.4% in Q2FY27 from 6.7% a year earlier, matching the faster 25% growth in PAT versus 15% growth in revenue. Cash PAT margin rose to 10.4% from 9.9%, a 50-basis-point increase over the same period.
J. Kumar’s Q2FY27 cost of material consumed was Rs 989 crore, compared with Rs 871 crore in Q2FY26, while construction expenses rose to Rs 184 crore from Rs 151 crore. Employee expenses increased to Rs 111 crore from Rs 102 crore and other expenses reached Rs 27 crore from Rs 24 crore, alongside revenue of Rs 1,539 crore.
How did J. Kumar’s first-half earnings compare with last year?
J. Kumar reported H1FY27 revenue from operations of Rs 3,050 crore, up 8% from Rs 2,826 crore in H1FY26. EBITDA rose 8% to Rs 443 crore from Rs 411 crore, and EBIT also increased 8% to Rs 376 crore from Rs 349 crore.
J. Kumar’s H1FY27 PAT rose 9% to Rs 211 crore from Rs 194 crore, while cash PAT increased 10% to Rs 309 crore from Rs 281 crore. The first-half PAT increase was below the quarterly 25% growth rate, as H1FY27 includes both Q1FY27 and Q2FY27.
J. Kumar’s H1FY27 EBITDA margin was 14.5%, slightly below 14.6% in H1FY26, even though the Q2FY27 margin rose to 14.9% from 14.5%. H1FY27 EBIT margin was unchanged at 12.3%, PAT margin held at 6.9%, and cash PAT margin increased to 10.1% from 9.9%.
J. Kumar reported H1FY27 PBT of Rs 289 crore, 7% above Rs 269 crore in H1FY26, while finance cost rose to Rs 87 crore from Rs 80 crore. H1FY27 depreciation was Rs 99 crore versus Rs 87 crore, other income increased to Rs 32 crore from Rs 24 crore, and tax expense rose to Rs 79 crore from Rs 75 crore.
Got a follow-up? Ask IRIS
What do J. Kumar’s balance sheet and cash flows show?
J. Kumar’s consolidated total assets stood at Rs 6,282 crore at September 2026, up from Rs 6,197 crore at March 2026. Total shareholders’ funds rose to Rs 3,561 crore from Rs 3,368 crore, while total equity and liabilities also amounted to Rs 6,282 crore at September 2026.
J. Kumar’s trade receivables increased to Rs 1,514 crore at September 2026 from Rs 1,491 crore at March 2026, while inventories declined to Rs 262 crore from Rs 331 crore. Cash and cash equivalents decreased to Rs 140 crore from Rs 203 crore, although bank balances other than cash equivalents increased to Rs 561 crore from Rs 490 crore.
J. Kumar’s non-current borrowings rose to Rs 336 crore at September 2026 from Rs 283 crore at March 2026, and current borrowings increased to Rs 487 crore from Rs 336 crore. Trade payables fell to Rs 674 crore from Rs 854 crore, while total current liabilities declined to Rs 2,106 crore from Rs 2,297 crore.
J. Kumar reported net cash used in operating activities of Rs 18 crore in H1FY27, compared with net cash generated from operating activities of Rs 411 crore in H1FY26. The cash-flow statement recorded a Rs 424 crore working-capital outflow in H1FY27, against a Rs 34 crore inflow in H1FY26, and closing cash balance was Rs 140 crore compared with Rs 78 crore a year earlier.
Conclusion
J. Kumar’s Q2FY27 consolidated results showed profit growth exceeding revenue growth: PAT increased 25% to Rs 113 crore while revenue rose 15% to Rs 1,539 crore. The quarterly outcome coincided with EBITDA margin increasing to 14.9%, EBIT margin to 12.6%, PAT margin to 7.4% and cash PAT margin to 10.4%, whereas H1FY27 EBITDA and PAT margins were 14.5% and 6.9%, respectively.
The disclosed issue to watch in subsequent results is working capital, after H1FY27 net operating cash outflow of Rs 18 crore followed a Rs 424 crore working-capital outflow, versus Rs 411 crore of operating cash generation in H1FY26. Investors can also monitor borrowings, which rose to Rs 823 crore at September 2026 from Rs 619 crore at March 2026 when current and non-current balances are combined.