










Jagran operating cash inflow falls 52% to Rs 59.22 crore
Key highlights
- Jagran's H1FY27 net operating cash inflow was Rs 59.22 crore, down from Rs 123.28 crore in H1FY26.
- Jagran reported Rs 183.23 crore of net cash inflow from investing activities in H1FY27, versus a Rs 14.41 crore outflow a year earlier.
- Jagran's financing activities used Rs 255.55 crore in H1FY27, compared with Rs 139.70 crore in H1FY26.
- Jagran's cash and cash equivalents were Rs 36.70 crore at September 2026, down from Rs 49.81 crore at March 2026.
powered by IRIS
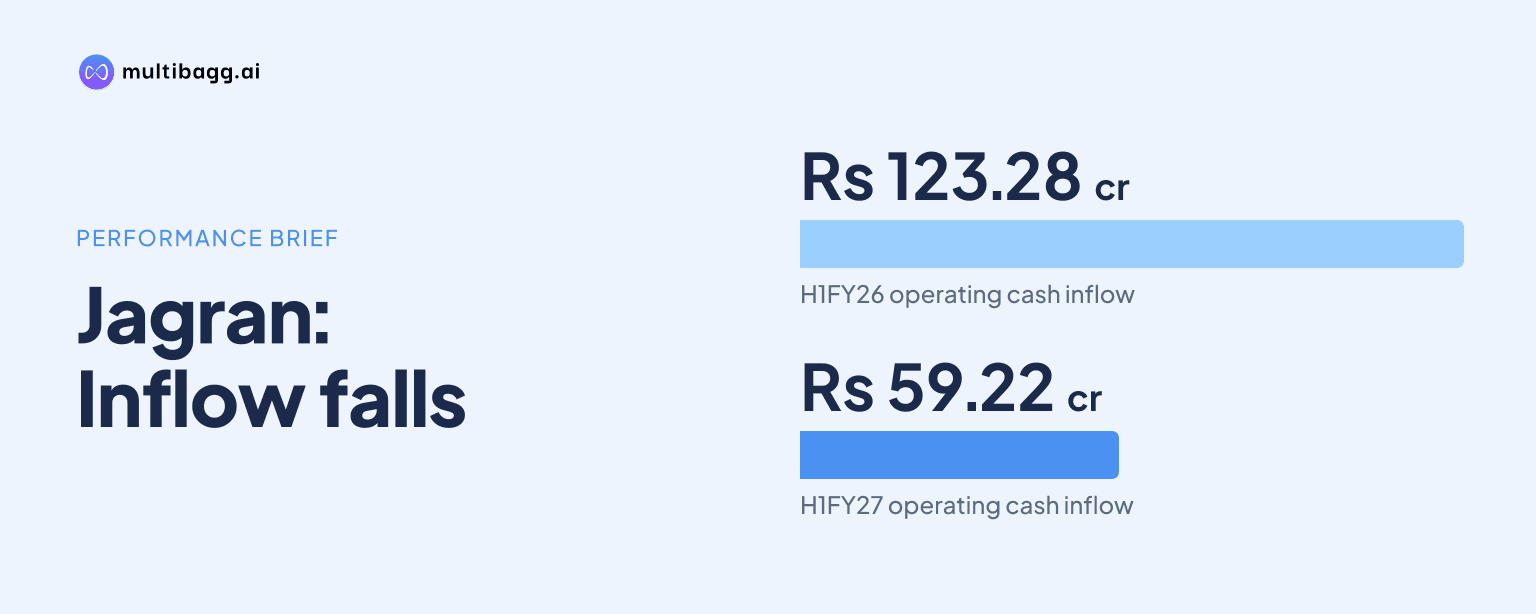
Jagran Prakashan Limited recorded net cash inflow from operating activities of Rs 59.22 crore in H1FY27, down 52% from Rs 123.28 crore in H1FY26, while investing activities generated Rs 183.23 crore and financing activities used Rs 255.55 crore. Cash and cash equivalents consequently fell to Rs 36.70 crore at September 2026 from Rs 49.81 crore at March 2026.
Know Jagran Prakashan inside out
Results, valuation, peers and who's buying, in one view.
Why did Jagran's operating cash inflow decline in H1FY27?
Jagran's operating cash inflow declined as cash generated from operations fell to Rs 90.61 crore in H1FY27 from Rs 157.55 crore in H1FY26, while income taxes paid remained Rs 31.39 crore. The resulting Rs 59.22 crore net operating inflow was Rs 64.06 crore below the prior-year half, even though net tax payments were Rs 2.88 crore lower than Rs 34.27 crore in H1FY26.
The decline was visible before working-capital movements. Cash flow before working-capital changes was Rs 2.97 crore in H1FY27, compared with Rs 15.52 crore in H1FY26, while the stated change in operating assets and liabilities was Rs 87.64 crore versus Rs 142.03 crore a year earlier. Profit before income tax also fell to Rs 139.20 crore from Rs 161.50 crore, and adjustments were Rs 136.23 crore against Rs 145.98 crore a year earlier.
The income statement shows a narrower operating result over the same six-month period. Consolidated operating profit was Rs 127.35 crore in H1FY27, down from Rs 130.37 crore in H1FY26, while the operating profit margin declined to 12.83% from 14.06%. Revenue increased 7% to Rs 992.79 crore, but raw-material cost rose to Rs 268.42 crore from Rs 213.18 crore.
How did Jagran's investing activities produce Rs 183.23 crore?
Jagran reported a net cash inflow of Rs 183.23 crore from investing activities in H1FY27, compared with a net outflow of Rs 14.41 crore in H1FY26. The cash-flow statement presents only the aggregate investing line, so it does not identify within the supplied presentation which investment sales, maturities, purchases or other transactions produced the Rs 197.64 crore year-on-year swing.
The balance sheet records lower investment balances at September 2026. Non-current investments were Rs 356.71 crore, down from Rs 385.25 crore at March 2026, while current investments were Rs 684.91 crore, down from Rs 772.77 crore. Together, these reported investment categories declined by Rs 116.40 crore over the six months alongside the positive investing cash-flow total.
Other asset movements were mixed. Property, plant and equipment declined to Rs 279.24 crore from Rs 292.71 crore, but capital work-in-progress rose to Rs 3.28 crore from Rs 0.71 crore. Right-of-use assets increased to Rs 83.53 crore from Rs 74.65 crore, while other non-current assets rose to Rs 20.14 crore from Rs 8.73 crore.
What drove Jagran's Rs 255.55 crore financing outflow?
Jagran used Rs 255.55 crore in financing activities during H1FY27, an outflow Rs 115.85 crore larger than the Rs 139.70 crore outflow in H1FY26. The supplied cash-flow statement does not break this line into dividends, debt repayments, lease payments, share transactions or other financing components, so the specific cause of the increase is not disclosed.
Current borrowings fell to Rs 16.75 crore at September 2026 from Rs 35.66 crore at March 2026. That Rs 18.91 crore reduction occurred alongside the reported financing outflow, but the presentation does not establish that it was the principal driver of the Rs 255.55 crore cash use. Current lease liabilities rose to Rs 16.15 crore from Rs 12.89 crore, while non-current lease liabilities edged down to Rs 60.66 crore from Rs 61.32 crore.
Equity also decreased over the half year. Total equity was Rs 2,017.48 crore at September 2026, compared with Rs 2,131.08 crore at March 2026, as other equity declined to Rs 1,854.26 crore from Rs 1,972.00 crore. Equity attributable to owners was Rs 1,897.79 crore, down from Rs 2,015.53 crore, while non-controlling interests increased to Rs 119.68 crore from Rs 115.55 crore.
Got a follow-up? Ask IRIS
What changed in Jagran's cash and short-term liquidity position?
Jagran's cash and cash equivalents decreased by Rs 13.11 crore in H1FY27 to Rs 36.70 crore, although the decline was smaller than the Rs 30.83 crore decrease reported in H1FY26. The period began with Rs 49.81 crore of cash and cash equivalents, compared with an opening Rs 54.90 crore in the preceding-year half, and ended with Rs 24.08 crore in H1FY26.
Bank balances other than cash and cash equivalents were Rs 38.40 crore at September 2026, down from Rs 54.12 crore at March 2026, and current investments stood at Rs 684.91 crore. Total current assets were broadly stable at Rs 1,524.41 crore, compared with Rs 1,526.13 crore at March 2026.
The composition of current assets changed over the half. Trade receivables increased to Rs 503.52 crore from Rs 439.85 crore, while inventories rose to Rs 83.08 crore from Rs 42.34 crore. These increases were partly offset by lower current investments and cash balances; the presentation does not provide ageing data or collection metrics to explain the receivables movement.
How did Jagran's liabilities change by September 2026?
Jagran's total liabilities increased to Rs 658.77 crore at September 2026 from Rs 578.07 crore at March 2026, driven by current liabilities rising to Rs 504.73 crore from Rs 428.27 crore. Non-current liabilities increased more modestly to Rs 154.04 crore from Rs 149.80 crore, including deferred tax liabilities of Rs 71.33 crore versus Rs 66.21 crore.
Trade payables to creditors other than micro and small enterprises rose to Rs 202.25 crore from Rs 127.89 crore, an increase of Rs 74.36 crore. Other current liabilities also increased to Rs 126.82 crore from Rs 115.60 crore, while other financial liabilities rose to Rs 133.76 crore from Rs 127.62 crore. These balance-sheet changes coincide with the Rs 87.64 crore reported change in operating assets and liabilities, but the cash-flow statement does not provide a line-by-line reconciliation.
Conclusion
Jagran's H1FY27 cash profile combined lower operating cash generation with a large reported investing inflow and a larger financing outflow. Operating cash inflow fell to Rs 59.22 crore despite Rs 992.79 crore of operating revenue, while the Rs 183.23 crore investing inflow did not prevent a Rs 13.11 crore reduction in cash and cash equivalents because financing activities used Rs 255.55 crore.
The next results should indicate whether operating cash flow changes as receivables of Rs 503.52 crore and inventories of Rs 83.08 crore evolve, and whether the financing outflow recurs. Management also says integrating radio offerings with digital offerings is expected to result in meaningful revenues, while it cites a better outlook supported by lower newsprint costs; subsequent disclosures can indicate whether either factor changes operating profit or cash conversion.