










Jain Metal Group Returns to Positive H1 FY27 Operating Cash Flow
Key highlights
- Jain Metal Group reported Rs 129.6 crore of net operating cash inflow in H1 FY27, versus a Rs 403.2 crore outflow in FY26.
- Working-capital days fell to 49 in H1 FY27 from 66 in FY26, as inventory days declined to 47 from 62.
- Trade receivables rose to Rs 706 crore and trade payables rose to Rs 642.9 crore at September 2026.
- Net debt to equity declined to 0.5 times in H1 FY27 from 0.7 times in FY26.
powered by IRIS
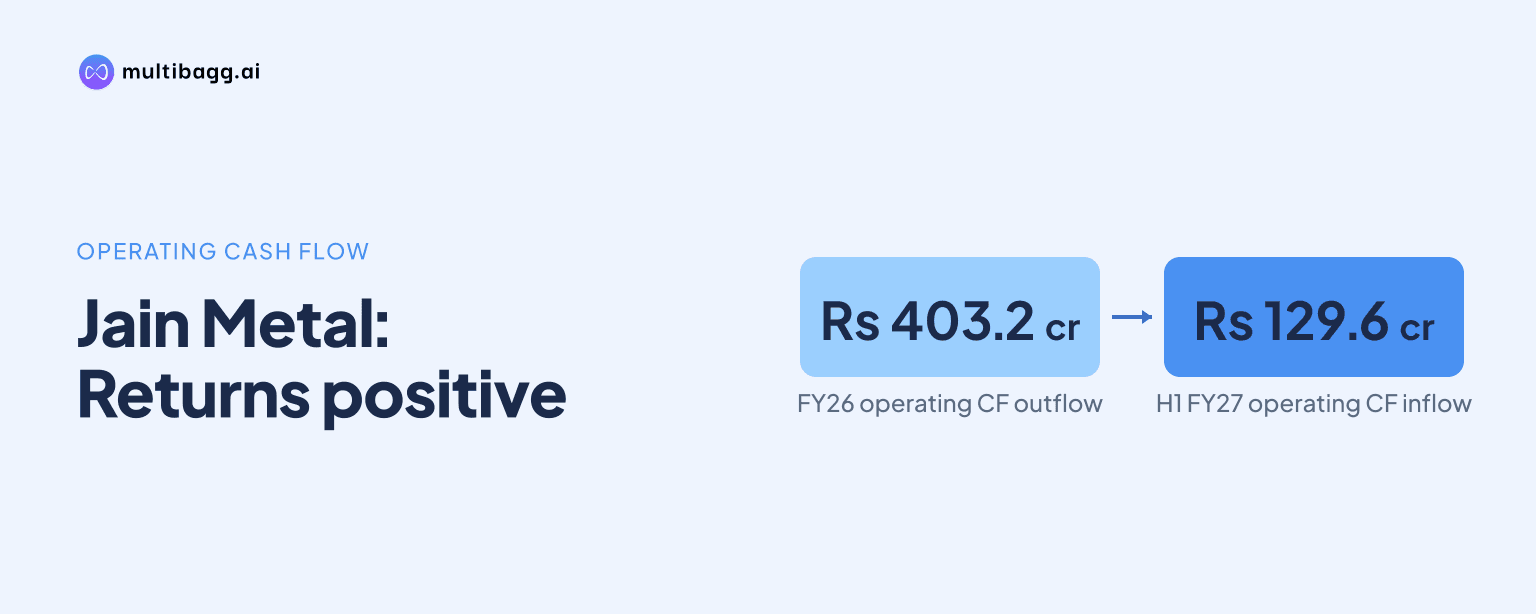
Jain Resource Recycling Limited, referred to as Jain Metal Group, reported Rs 129.6 crore of net cash from operating activities in H1 FY27, reversing the Rs 403.2 crore outflow reported in FY26, while working-capital days fell to 49 from 66. Net debt to equity also declined to 0.5 times from 0.7 times.
Know Jain Resource Recycling inside out
Results, valuation, peers and who's buying, in one view.
Did Jain Metal Group return to positive operating cash flow?
Yes, Jain Metal Group recorded net cash from operating activities of Rs 129.6 crore in H1 FY27, compared with negative Rs 403.2 crore in FY26. Cash generated from operations before direct taxes was Rs 178.6 crore in H1 FY27, against negative Rs 353.8 crore for FY26. Net profit before tax in the cash-flow statement was Rs 217.9 crore for the half year.
The cash-flow bridge shows Rs 501.3 crore generated from operations before working-capital changes in H1 FY27, followed by a Rs 322.7 crore working-capital cash outflow and Rs 48.6 crore of direct taxes paid. That sequence resulted in the Rs 129.6 crore operating cash inflow. In FY26, cash generated before working-capital changes was Rs 179 crore, while the working-capital outflow was higher at Rs 532.8 crore.
The improvement represents a reversal in reported operating cash flow, although H1 FY27 covers six months and FY26 covers a full year. The reported working-capital cash outflow was Rs 210.1 crore lower between the two presented periods. FY25 also produced positive operating cash flow of Rs 3.6 crore, compared with Rs 33.4 crore in FY24 and Rs 10.9 crore in FY23.
How did Jain Metal Group reduce working-capital days?
Jain Metal Group reduced reported working-capital days to 49 in H1 FY27 from 66 days in FY26, as inventory days declined to 47 from 62. Debtor days were unchanged at 18, while creditor days increased to 16 from 14. The disclosed day metrics show a 17-day reduction in the overall working-capital cycle against FY26.
The H1 FY27 figure remained above the 38 working-capital days reported in FY25, when inventory days were 34, debtor days were eight and creditor days were four. The FY26 increase to 66 days followed the FY25 level of 38 days, with inventory days rising by 28 days to 62 and debtor days increasing by 10 days to 18. H1 FY27 partly reversed the inventory-day increase but did not reduce debtor days below the FY26 level.
The presentation notes that FY25 included operations of M/s Ikon Square Limited UAE, or ISL, which was engaged in gold and silver refining. Jain Metal Group’s board approved discontinuation of ISL’s operations effective April 17, 2025, citing low margins, high operating costs, working-capital constraints and sector volatility under stringent anti-money-laundering regulations. This discontinuation is relevant context for comparing FY25 operating metrics with later periods.
Got a follow-up? Ask IRIS
Why did receivables and payables rise despite fewer working-capital days?
Jain Metal Group’s trade receivables rose to Rs 706 crore at September 2026 from Rs 476 crore at March 2026, while trade payables increased to Rs 642.9 crore from Rs 339.8 crore. At the same time, debtor days stayed at 18 and creditor days increased to 16 in H1 FY27. The presentation therefore reports differing movements in its day-based measures and point-in-time balance-sheet balances.
Inventories declined to Rs 1,461 crore at September 2026 from Rs 1,476.7 crore at March 2026, consistent with inventory days falling to 47 from 62. However, other current assets rose to Rs 962.1 crore from Rs 590 crore, while total current assets increased to Rs 3,383.6 crore from Rs 3,154 crore. Current liabilities also rose to Rs 1,928.6 crore from Rs 1,767.4 crore.
The presentation does not provide a line-by-line reconciliation between the increase in receivables and payables and the 49 working-capital-day metric. It shows receivables rising by Rs 230 crore and payables rising by Rs 303.1 crore during the period, while the cash-flow statement recorded a Rs 322.7 crore working-capital outflow. The disclosed figures therefore distinguish day ratios from absolute balance-sheet amounts.
What do leverage and earnings show in H1 FY27?
Jain Metal Group reported net debt to equity of 0.5 times in H1 FY27, down from 0.7 times in FY26 and 0.9 times in FY25. Total equity rose to Rs 1,719.7 crore at September 2026 from Rs 1,558.1 crore at March 2026. Current borrowings fell to Rs 1,084.4 crore from Rs 1,276.2 crore over the same period.
Revenue from operations was Rs 6,061.4 crore in H1 FY27, compared with Rs 9,543.1 crore in FY26, which is a half-year versus full-year comparison. Earnings before interest, tax, depreciation and amortisation were Rs 248.3 crore in H1 FY27, with a 4.1% margin, versus Rs 558.9 crore and a 5.9% margin in FY26. Profit for the period was Rs 160 crore in H1 FY27, with a 2.6% margin.
Cash and cash equivalents on the balance-sheet statement were Rs 29.6 crore at September 2026, down from Rs 69.7 crore at March 2026. The cash-flow statement reports a Rs 40.1 crore net decrease in cash and cash equivalents during H1 FY27, alongside Rs 75.4 crore of net cash from investing activities and Rs 245 crore of net cash used in financing activities. Capital work-in-progress increased to Rs 93.6 crore from Rs 45 crore during the period.
Conclusion
Jain Metal Group’s H1 FY27 presentation records a return to positive operating cash flow of Rs 129.6 crore after the Rs 403.2 crore FY26 outflow. The change coincided with working-capital days falling by 17 days to 49, lower inventory days and a smaller working-capital cash outflow, even as trade receivables and trade payables both increased in absolute rupee terms.
An unresolved matter in the presentation is the link between the 49-day working-capital metric and the balance-sheet movements in receivables of Rs 706 crore, payables of Rs 642.9 crore and other current assets of Rs 962.1 crore. The presentation provides no line-by-line reconciliation of those balances to the reported working-capital days, making subsequent disclosures relevant to tracking cash conversion and capital deployment, including Rs 93.6 crore of capital work-in-progress.