










KINGFA H1 revenue rises 52% as domestic sales grow 53%
Key highlights
- KINGFA’s H1 FY 2026-27 revenue from operations rose 52.18% to Rs 1,411.65 crore.
- KINGFA’s domestic sales increased 53.4% to Rs 1,313.37 crore and accounted for 93% of H1 revenue.
- KINGFA’s export sales rose 37.2% to Rs 98.28 crore, while export revenue share declined to 7% from 8%.
- KINGFA’s Q2 FY 2026-27 revenue from operations increased 55.27% year on year to Rs 723.08 crore.
powered by IRIS
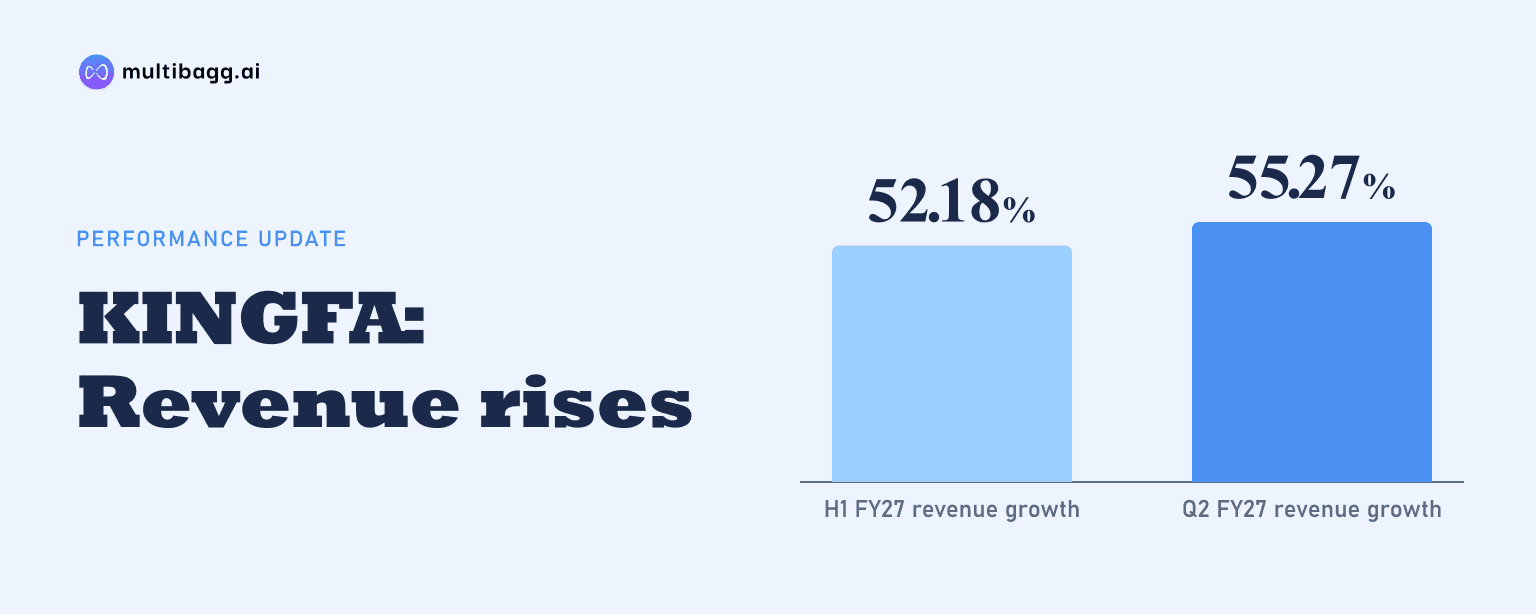
KINGFA reported revenue from operations of Rs 1,411.65 crore in H1 FY 2026-27, up 52.18% year on year from Rs 927.62 crore, as domestic sales rose 53.4% to Rs 1,313.37 crore and accounted for 93% of revenue. Export sales increased 37.2% to Rs 98.28 crore but represented 7% of the total.
Know Kingfa Science & Technology (India) inside out
Results, valuation, peers and who's buying, in one view.
What drove KINGFA’s H1 revenue growth?
KINGFA’s domestic business drove H1 FY 2026-27 revenue growth, adding Rs 457.38 crore year on year as sales increased from Rs 856.00 crore in H1 FY 2025-26 to Rs 1,313.37 crore. The 53.4% domestic-sales increase was higher than the company’s overall 52.18% rise in revenue from operations.
Export sales also increased, but made a smaller contribution to the Rs 484.03 crore rise in total revenue from operations. Exports rose by Rs 26.65 crore, from Rs 71.63 crore in H1 FY 2025-26 to Rs 98.28 crore in H1 FY 2026-27, representing 37.2% growth. Based on the reported sales figures, domestic business contributed about 94.5% of the total increase, while exports accounted for about 5.5%.
The reported difference in growth rates shows that the increase was concentrated in the domestic channel rather than arising equally across both channels. KINGFA’s presentation does not provide product, customer, geography or end-market details for the Rs 1,313.37 crore of domestic sales, so it does not identify the specific source of the domestic increase.
How did KINGFA’s sales mix change in H1?
KINGFA’s sales mix shifted further towards domestic revenue in H1 FY 2026-27, with domestic sales representing 93% of revenue compared with 92% in H1 FY 2025-26. Export sales represented the remaining 7%, down from 8% in the comparable prior-year half, despite export revenue rising by Rs 26.65 crore.
The one-percentage-point reduction in export mix reflects the relative pace of growth rather than a decline in export activity. Domestic sales grew 53.4%, compared with 37.2% for exports, and the domestic-to-export revenue gap widened to Rs 1,215.09 crore in H1 FY 2026-27 from Rs 784.37 crore a year earlier.
The presentation’s H1 sales data identifies only domestic and export channels. It does not disclose the share of the Rs 1,411.65 crore of revenue from operations attributable to automotive or non-automotive applications, although its historical sales-performance page includes an auto-versus-non-auto business chart without numerical H1 FY 2026-27 data.
How does KINGFA’s growth compare with vehicle production?
KINGFA’s 53.4% domestic-sales growth in H1 FY 2026-27 was above the 20.4% year-on-year increase in India’s total vehicle production shown in the presentation. Total production increased to 1,99,65,193 units in 2026-27 H1 from 1,65,78,170 units in 2025-26 H1.
Three-wheelers recorded the fastest vehicle-production growth at 30.5% during the half year, followed by commercial vehicles at 24.7%, passenger vehicles at 21.8% and two-wheelers at 19.5%. Passenger-vehicle production increased to 31,32,362 units from 25,72,562 units, while commercial-vehicle production rose to 6,51,215 units from 5,22,172 units.
These production figures provide industry context, not a disclosed explanation for KINGFA’s revenue performance. The presentation does not quantify whether the Rs 457.38 crore domestic-sales increase came from automotive materials, non-automotive materials, volume growth, pricing, new customers or any individual vehicle category.
Got a follow-up? Ask IRIS
Does KINGFA’s Q2 result support the H1 trend?
KINGFA’s Q2 FY 2026-27 revenue from operations rose 55.27% year on year to Rs 723.08 crore, exceeding the 52.18% H1 growth rate. Q2 revenue from operations was Rs 465.69 crore in Q2 FY 2025-26, making the reported quarterly increase Rs 257.39 crore.
Domestic sales rose to Rs 678.44 crore in Q2 FY 2026-27 from Rs 430.87 crore a year earlier, while export sales increased to Rs 44.64 crore from Rs 34.82 crore. Domestic business accounted for 94% of Q2 revenue, compared with 93% in Q2 FY 2025-26, and export share fell to 6% from 7%.
The Q2 mix therefore extended the H1 pattern of domestic sales expanding faster than exports. The presentation reports 53.4% domestic growth for H1 and gives Q2 domestic sales of Rs 678.44 crore, but it does not provide a stated Q2 domestic-sales growth percentage or explain the change in the domestic share from 93% in H1 to 94% in Q2.
What did KINGFA report on Q2 earnings?
KINGFA’s financial-statement extract reported total income from operations of Rs 737.19 crore for the quarter ended September 30, 2026, compared with Rs 693.74 crore for the quarter ended June 30, 2026. The sales-performance table separately reported Q2 revenue from operations of Rs 723.08 crore for FY 2026-27.
Net profit after tax was Rs 47.03 crore in the September 2026 quarter, compared with Rs 80.21 crore in the June 2026 quarter. Profit before tax was Rs 63.49 crore in Q2 and Rs 107.54 crore in Q1, while total comprehensive income was Rs 46.77 crore and Rs 80.27 crore, respectively.
The presentation does not reconcile the Rs 14.11 crore difference between Q2 total income from operations and Q2 revenue from operations, nor does it explain the sequential movement in profit after tax. It reports both measures for FY 2026-27, with the financial-statement extract labelling the September and June quarter figures as unaudited.
Conclusion
KINGFA’s H1 FY 2026-27 revenue increase was led primarily by domestic sales. Revenue from operations rose 52.18% to Rs 1,411.65 crore, while domestic sales rose 53.4% to Rs 1,313.37 crore and increased their share of revenue to 93%; export sales grew 37.2% to Rs 98.28 crore but their share declined to 7%.
The unresolved matters in the presentation are the drivers of the domestic-sales increase, the composition of revenue by end-market, and the difference between Q2 revenue from operations and total income from operations. Future company disclosures can clarify whether domestic sales remain near Q2’s 94% revenue share and provide further detail on the sequential change in profit after tax from Rs 80.21 crore to Rs 47.03 crore.