










KP Green Engineering Ltd. PAT Falls 41% While Costs Rise
Key highlights
- KP Green Engineering’s H1 FY27 revenue from operations rose 28% to Rs 679 crore.
- KP Green Engineering’s H1 FY27 PAT fell 41% to Rs 34 crore and PAT margin declined to 5%.
- KP Green Engineering’s interest cost rose 114% to Rs 34 crore, while depreciation and amortisation reached Rs 36 crore.
- KP Green Engineering reported debt of Rs 447 crore and debt to equity of 0.91 times in H1 FY27.
powered by IRIS
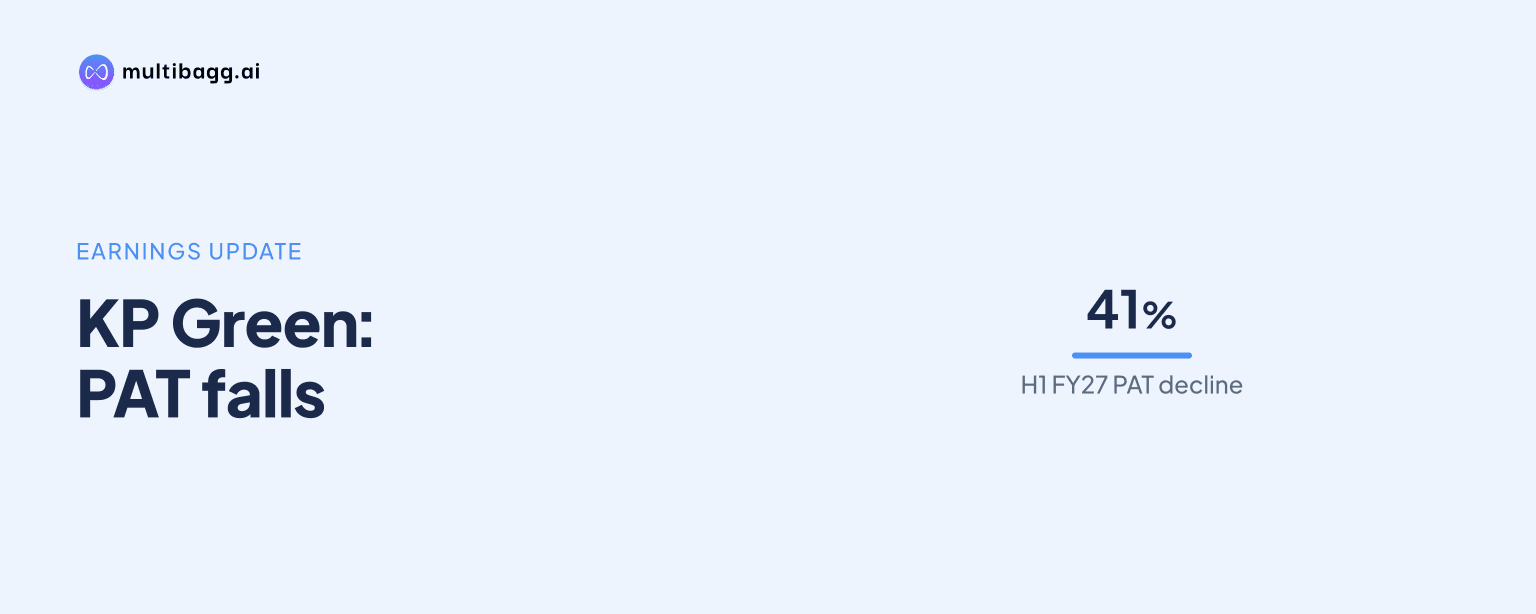
KP Green Engineering Ltd.’s profit after tax (PAT) fell 41% year on year to Rs 34 crore in H1 FY27, despite a 28% rise in revenue from operations to Rs 679 crore. Earnings before interest, tax, depreciation and amortisation (EBITDA) rose 17% to Rs 119 crore, but interest cost and depreciation increased sharply, reducing PAT margin to 5% from 11%.
Know KP Green Engineering inside out
Results, valuation, peers and who's buying, in one view.
How did KP Green Engineering’s H1 FY27 revenue and profit change?
KP Green Engineering increased revenue from operations to Rs 679 crore in H1 FY27 from Rs 532 crore in H1 FY26, a 28% rise, while total income grew 27% to Rs 682 crore from Rs 536 crore. The revenue gain did not carry through at the same rate to operating profit or net profit, as total operating expense increased 30% to Rs 563 crore from Rs 434 crore.
KP Green Engineering’s EBITDA rose by Rs 17 crore to Rs 119 crore in H1 FY27, but its EBITDA margin declined to 17% from 19%. PAT declined by Rs 24 crore to Rs 34 crore, while earnings per share fell 41% to Rs 6.9 from Rs 11.6.
Why did KP Green Engineering’s PAT fall despite higher revenue?
KP Green Engineering’s PAT fell as interest cost more than doubled to Rs 34 crore and depreciation and amortisation increased to Rs 36 crore, exceeding the Rs 17 crore increase in EBITDA. Interest cost was Rs 16 crore in H1 FY26, making the H1 FY27 expense 114% higher, while depreciation and amortisation was Rs 8 crore a year earlier, a 356% increase.
The effect is also visible in profit before taxes, which decreased 36% to Rs 50 crore in H1 FY27 from Rs 78 crore in H1 FY26. KP Green Engineering’s EBITDA margin contracted by 2 percentage points to 17%, while its PAT margin contracted by 6 percentage points to 5%, showing that both operating expenses and charges below EBITDA affected the conversion of revenue into net earnings.
How did KP Green Engineering’s debt and asset base change?
KP Green Engineering reported debt of Rs 447 crore in H1 FY27, compared with Rs 196 crore in H1 FY26, and debt to equity increased to 0.91 times from 0.51 times. Equity rose to Rs 491 crore from Rs 382 crore over the same periods, meaning debt increased faster than equity in the reported balance-sheet highlights.
The consolidated balance sheet recorded fixed assets of Rs 695 crore in September 2026, compared with Rs 332 crore in September 2025, a 109% increase. Shareholders’ funds were Rs 491 crore, non-current liabilities were Rs 245 crore and current liabilities were Rs 1,096 crore in H1 FY27, bringing the balance-sheet total to Rs 1,831 crore.
Got a follow-up? Ask IRIS
What does KP Green Engineering’s cash flow show for H1 FY27?
KP Green Engineering reported an operating cash outflow of Rs 110 crore in H1 FY27, compared with an operating cash inflow of Rs 57 crore in H1 FY26. This differed from the increase in reported cash profit to Rs 75 crore from Rs 67 crore during the same comparison.
Financing activities provided Rs 127 crore in H1 FY27, up from Rs 88 crore in H1 FY26, while investing activities used Rs 11 crore, compared with an outflow of Rs 149 crore a year earlier. Cash and cash equivalents were Rs 15 crore at the end of H1 FY27, compared with Rs 10 crore at the end of H1 FY26, and the statement recorded a Rs 6 crore net increase during H1 FY27.
How does H1 FY27 compare with KP Green Engineering’s FY26 results?
KP Green Engineering’s H1 FY27 revenue from operations of Rs 679 crore was more than half of FY26 revenue of Rs 1,246 crore, while H1 EBITDA of Rs 119 crore was below half of FY26 EBITDA of Rs 249 crore. EBITDA margin was 17% in H1 FY27, compared with 20% for FY26, although the presentation shows a half-year period alongside a full financial year.
KP Green Engineering reported PAT of Rs 34 crore in H1 FY27 against Rs 136 crore in FY26, while cash profit was Rs 75 crore against Rs 166 crore for the full year. The presentation also states that related-party, or group-company, revenue accounted for 17.0% in H1 FY27, down from 49.5% in FY26; this is a comparison between a half-year and a full-year period.
Conclusion
KP Green Engineering delivered higher H1 FY27 revenue and EBITDA, but operating expense grew 30% against 27% total-income growth and the rise in interest cost and depreciation was much steeper than EBITDA growth. The result was a 41% fall in PAT, a PAT margin of 5%, debt to equity of 0.91 times and negative operating cash flow of Rs 110 crore.
The presentation discloses no forward target, plan or scheduled financial event. The unresolved matters are whether the Rs 110 crore operating cash outflow changes in later reporting periods and how debt of Rs 447 crore, alongside fixed assets of Rs 695 crore in September 2026, develops relative to earnings and cash generation.