










La Opala H1 Revenue Rises 10.6% as EBITDA Margin Falls 207 Basis Points
Key highlights
- La Opala’s H1 FY27 revenue increased 10.61% to Rs 172.7305 crore.
- La Opala’s H1 FY27 EBITDA margin fell 207 basis points to 35.91%.
- La Opala’s H1 FY27 PAT declined 1.23% to Rs 51.4957 crore.
- La Opala’s H1 FY27 other income declined 14.33% to Rs 17.7118 crore.
powered by IRIS
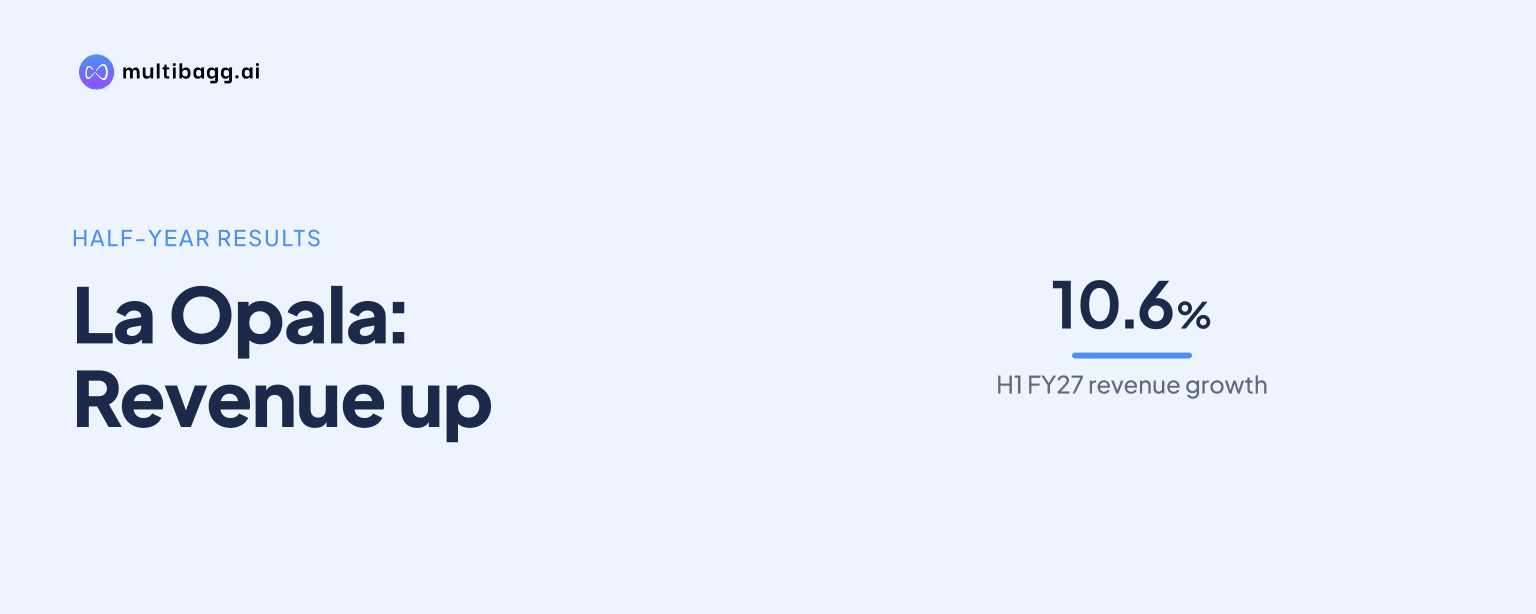
La Opala RG Limited reported H1 FY27 revenue from operations of Rs 172.7305 crore, up 10.61% year on year, while earnings before interest, tax, depreciation and amortisation (EBITDA), excluding other income, margin fell 207 basis points to 35.91% and profit after tax (PAT) declined 1.23% to Rs 51.4957 crore.
Know La Opala RG inside out
Results, valuation, peers and who's buying, in one view.
What did La Opala report in H1 FY27?
La Opala reported H1 FY27 revenue of Rs 172.7305 crore, compared with Rs 156.1671 crore in H1 FY26, while EBITDA excluding other income rose 4.57% to Rs 62.0196 crore. Revenue grew faster than EBITDA, reducing the EBITDA margin to 35.91% from 37.98% in the preceding-year half.
The comparison shows sales, operating profit and net profit moving at different rates in the two half years. Profit before tax (PBT) fell 0.74% despite the growth in EBITDA, while PAT declined 1.23%.
La Opala’s gross profit rose 7.85% to Rs 114.1939 crore from Rs 105.8808 crore, but gross margin declined to 66.11% from 67.80%. Cost of goods sold increased 16.41% to Rs 58.5366 crore, exceeding the 10.61% rise in revenue.
Why did La Opala’s EBITDA margin decline?
La Opala’s EBITDA margin declined because cost of goods sold and other expenses grew faster than revenue in H1 FY27. Cost of goods sold rose to Rs 58.5366 crore from Rs 50.2863 crore, while other expenses increased 16.45% to Rs 20.131 crore from Rs 17.2876 crore.
Employee cost increased 9.41% to Rs 32.0433 crore from Rs 29.2861 crore, slower than revenue growth, but this did not offset the increases in cost of goods sold and other expenses. EBITDA rose by Rs 2.7125 crore, compared with a Rs 16.5634 crore increase in revenue, resulting in the 207-basis-point margin decline.
La Opala’s H1 FY27 EBITDA margin of 35.91% was also 95 basis points below its FY26 margin of 36.86%. For FY26, the company reported EBITDA excluding other income of Rs 113.9365 crore on revenue of Rs 309.0646 crore.
How did other income affect La Opala’s H1 profit?
La Opala’s lower other income contributed to the declines in reported PBT and PAT despite higher EBITDA. Other income fell 14.33% to Rs 17.7118 crore in H1 FY27 from Rs 20.6751 crore, a decrease of Rs 2.9633 crore that was larger than the Rs 2.7125 crore increase in EBITDA.
PBT excluding other income increased 5.28% to Rs 49.1805 crore from Rs 46.7141 crore. However, reported PBT declined to Rs 66.8923 crore from Rs 67.3892 crore as the reduction in other income and a Rs 0.6906 crore increase in depreciation outweighed the Rs 0.4455 crore fall in finance cost.
Depreciation rose 6.83% to Rs 10.807 crore, while finance cost declined 17.95% to Rs 2.0321 crore. PAT margin consequently fell to 29.81% from 33.38%, a contraction of 357 basis points.
Got a follow-up? Ask IRIS
How did Q2 FY27 compare with the H1 trend?
La Opala’s Q2 FY27 revenue increased 11.52% year on year to Rs 101.3725 crore, while EBITDA rose 2.60% to Rs 36.0935 crore and the EBITDA margin fell to 35.60% from 38.70%. The quarterly margin decline of 310 basis points was wider than the 207-basis-point reduction for H1 FY27.
Q2 cost of goods sold rose 13.79% to Rs 36.4836 crore from Rs 32.0615 crore, while employee cost increased 16.42% to Rs 17.3458 crore and other expenses climbed 30.68% to Rs 11.4496 crore. Gross margin was 64.01% in Q2 FY27, compared with 64.73% in Q2 FY26.
The second quarter was higher than Q1 FY27 in absolute revenue and EBITDA, but its margin was lower. Revenue increased from Rs 71.358 crore in Q1 FY27 to Rs 101.3725 crore in Q2 FY27, EBITDA rose from Rs 25.9261 crore to Rs 36.0935 crore, and EBITDA margin eased from 36.33% to 35.60%.
What do La Opala’s capital and cash figures show?
La Opala reported operating return on capital employed (ROCE) of 14.41% in H1 FY27, compared with 14.24% in H1 FY26. Operating capital employed rose to Rs 256.6888 crore from Rs 243.2412 crore, while operating earnings before interest and tax increased to Rs 36.98 crore from Rs 34.6471 crore.
Current investments stood at Rs 491.3861 crore at the end of H1 FY27, up from Rs 468.0433 crore a year earlier, while non-current investments declined to Rs 69.2283 crore from Rs 98.4186 crore. Total equity was Rs 814.5026 crore, compared with Rs 801.8328 crore, and current borrowings declined to Rs 2.8006 crore from Rs 6.4815 crore.
Net cash from operating activities rose to Rs 24.7059 crore in H1 FY27 from Rs 23.7085 crore in H1 FY26. Cash generated from operations was Rs 38.7359 crore, while working-capital changes used Rs 23.9122 crore, compared with Rs 21.3764 crore in the earlier half; inventories were Rs 100.4348 crore and trade receivables were Rs 49.5939 crore.
Conclusion
La Opala increased H1 FY27 sales and absolute EBITDA, but cost of goods sold rose 16.41%, other expenses rose 16.45%, and other income declined 14.33%. The combination limited conversion of sales growth into reported profit, leaving PBT down 0.74% and PAT down 1.23%.
The presentation does not set a target for restoring margins or other income. The unresolved points to watch are whether cost growth moderates after Q2 other expenses rose 30.68% year on year and whether other income changes from the H1 FY27 level of Rs 17.7118 crore, alongside period-end current investments of Rs 491.3861 crore.