










MMF Forged-and-Machined Products Reach 67% of Q2FY27 Sales
Key highlights
- Forged-and-machined products represented 67% of MMF sales in Q2FY27, up from 58% in Q2FY26.
- MMF sales realisation increased to Rs 2.15 lakh per tonne in Q2FY27 from Rs 2.08 lakh a year earlier.
- MMF standalone Q2FY27 revenue increased 42% year on year to Rs 551 crore.
- Commercial vehicles accounted for 72.8% of MMF’s Q2FY27 overall revenue mix.
powered by IRIS
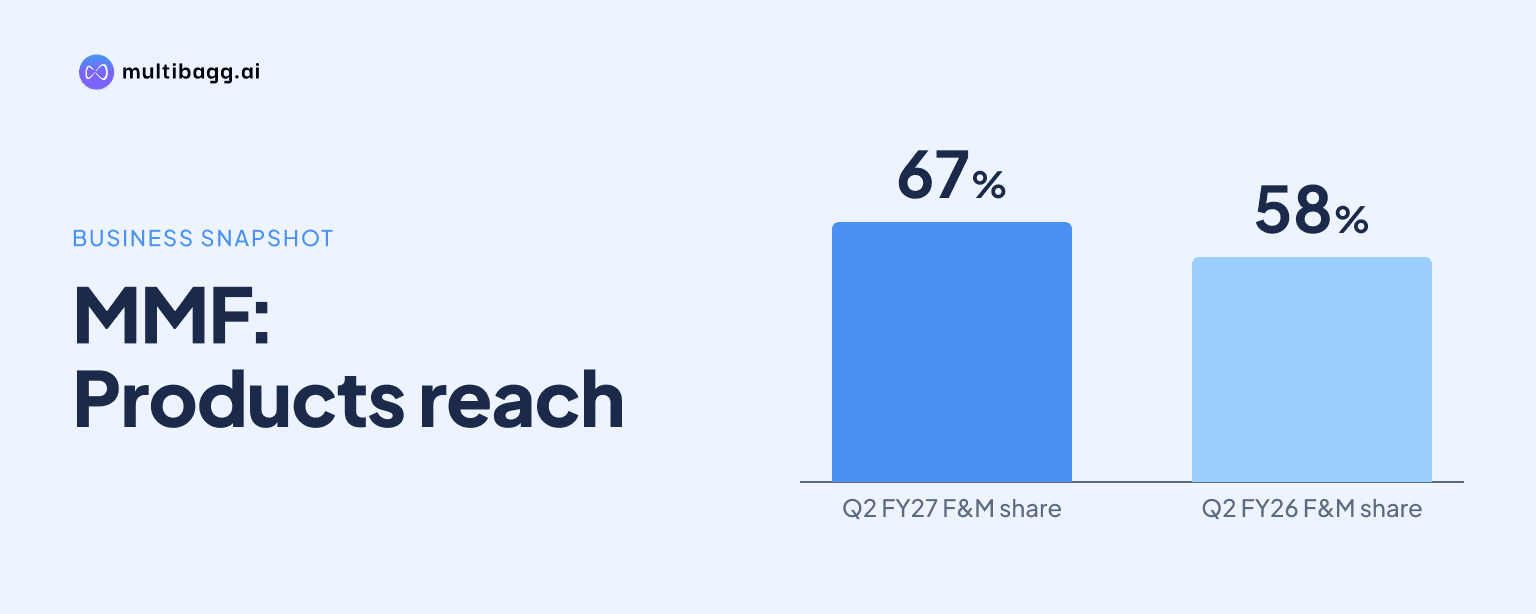
M M FORGINGS LIMITED reported forged-and-machined products at 67% of Q2FY27 sales, nine percentage points above Q2FY26, while sales realisation reached Rs 2.15 lakh per tonne from Rs 2.08 lakh. The mix change coincided with standalone revenue of Rs 551 crore, which was 42% higher year on year.
Know M M Forgings inside out
Results, valuation, peers and who's buying, in one view.
How did MMF’s product mix change in Q2FY27?
MMF reported that forged-and-machined products accounted for 67% of sales in Q2FY27, compared with 58% in Q2FY26, a nine-percentage-point increase. Forged products accounted for the remaining 33% in Q2FY27, down from 42% a year earlier, so the two disclosed categories continued to total 100% of sales in both quarters.
The Q2FY27 mix is consistent with the chairman’s H1FY27 statement that large machined-product programmes were ramping towards their full potential. Management also said it was diversifying beyond non-auto and heavy-duty segments, including passenger-vehicle forgings, although the presentation does not quantify the contribution of individual programmes to the 67% forged-and-machined share.
What changed in MMF’s operations and realisation per tonne?
MMF’s production mix moved towards the category labelled FS in Q2FY27, which represented 61% of production against 58% in Q2FY26. The presentation does not define FS or HF, but HF represented the remaining 39% of Q2FY27 production, down from 42%, marking a three-percentage-point shift in the disclosed operating mix.
Sales realisation per tonne increased by Rs 0.07 lakh year on year to Rs 2.15 lakh in Q2FY27. MMF presents that measure alongside its product and operating mix, but it does not identify a single cause for the increase, so the disclosure shows that these movements occurred in the same quarter rather than establishing causation.
Got a follow-up? Ask IRIS
Which end markets and regions made up MMF sales?
Commercial vehicles remained MMF’s largest end-market category in Q2FY27 at 72.8% of overall revenue, followed by passenger vehicles at 13.7% and agriculture and off-highway at 12.9%. The figures include scrap as recorded in the sales register, while the 0.6% Others category includes oilfield, engineering, railways and linen sales without a segment tag.
Domestic revenue supplied 67% of Q2FY27 sales, up from 64% in Q2FY26, while exports declined to 33% from 36%. Within the regional split, India increased three percentage points to 67% and the United States increased three points to 16%, while Europe fell five points to 13%, South America declined one point to 3%, and Others remained at 1%.
Commercial vehicles accounted for 78.0% of MMF’s export revenue in Q2FY27, compared with 67.2% of domestic revenue, showing a greater export concentration in that end market. Passenger vehicles represented 16.8% of domestic revenue versus 11.5% of export revenue, while agriculture and off-highway accounted for 15.5% domestically and 9.9% in exports.
How did the mix shift coincide with MMF’s financial performance?
MMF’s standalone Q2FY27 revenue increased 42% year on year to Rs 551 crore from Rs 389 crore. Earnings before interest, tax, depreciation and amortisation, or EBITDA, rose 53% to Rs 111 crore from Rs 72 crore, while profit before tax increased 139% to Rs 65 crore from Rs 27 crore.
Profit after tax, or PAT, rose 134% to Rs 46 crore in Q2FY27 from Rs 19 crore in Q2FY26, and earnings per share increased to Rs 9.51 from Rs 3.83. EBITDA growth exceeded revenue growth by 11 percentage points, based on the reported 53% and 42% increases, although MMF does not separately quantify the effect of the sales-mix change on either measure.
For H1FY27, revenue increased 29% to Rs 978 crore from Rs 759 crore, and EBITDA rose 34% to Rs 193 crore from Rs 144 crore. H1FY27 PAT was Rs 137 crore versus Rs 38 crore a year earlier, but the company said the result included Rs 56 crore net of tax from the Q1FY27 sale of land near Oragadam, classified as an exceptional item.
Conclusion
MMF’s Q2FY27 disclosures show a measurable shift towards forged-and-machined products, whose sales share increased nine percentage points to 67%, alongside a Rs 0.07 lakh rise in per-tonne realisation. Revenue reached Rs 551 crore and EBITDA reached Rs 111 crore, but the presentation does not attribute a specified part of either financial result to the product-mix movement.
The next point to watch is management’s stated ramp-up of large machined-product programmes towards full potential, alongside its diversification into passenger-vehicle forgings during H2FY27. Management also identified global trade uncertainty, foreign tariffs and selective export drag in Class 8 commercial-truck markets, relevant because exports were 33% of Q2FY27 sales and commercial vehicles were 72.8% of overall revenue.