










LCC Projects lifts EBITDA margin to 13.4% as PAT doubles
Key highlights
- LCC Projects’ revenue from operations rose 21.5% annually to Rs 3,600.3 crore in FY26 from Rs 2,438.9 crore in FY24.
- EBITDA excluding other income increased to Rs 481.7 crore in FY26 from Rs 266 crore in FY24, lifting the margin to 13.4%.
- PAT more than doubled to Rs 286.4 crore in FY26 from Rs 122 crore in FY24, while PAT margin rose to 7.9%.
- H1FY27 EBITDA margin reached 15.2%, PAT margin was 8.4%, and total debt-to-equity declined to 0.70 times after the IPO.
powered by IRIS
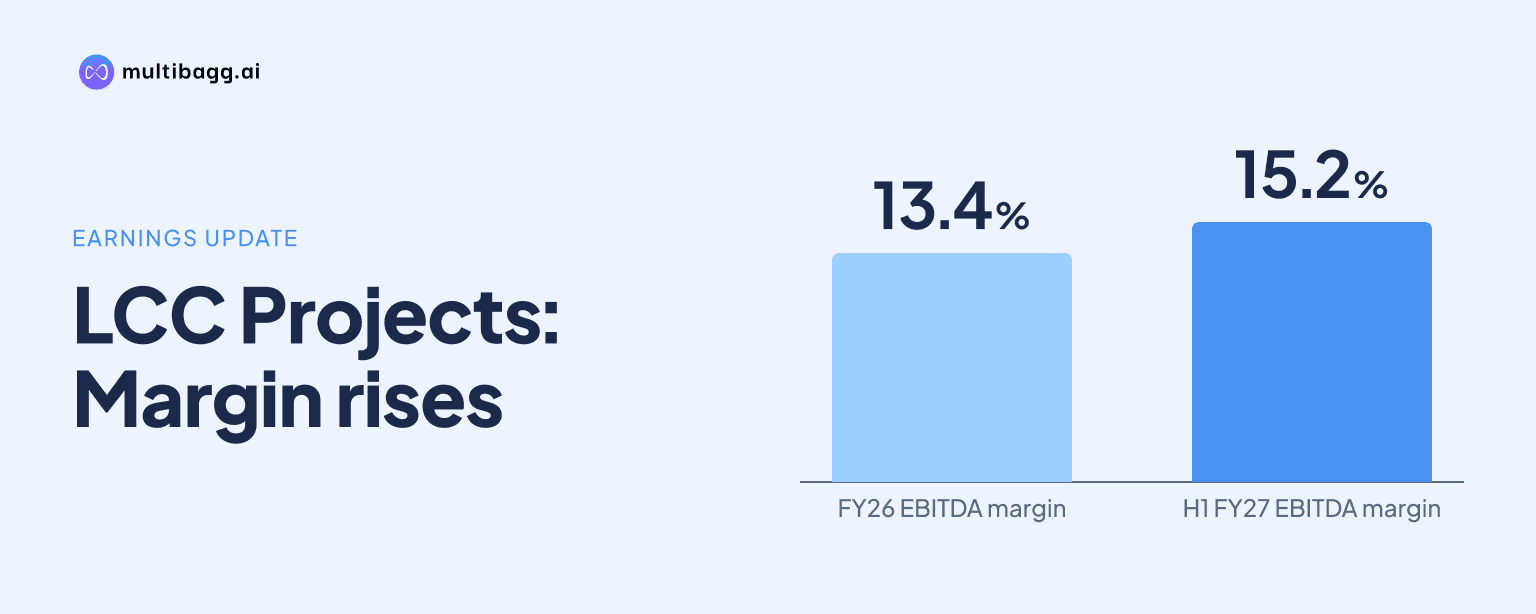
LCC Projects Limited lifted its EBITDA margin to 13.4% in FY26 from 10.9% in FY24 while revenue from operations grew at a 21.5% compound annual growth rate to Rs 3,600.3 crore. Profit after tax, or PAT, more than doubled to Rs 286.4 crore from Rs 122 crore, while H1FY27 reported a 15.2% EBITDA margin.
Know LCC Projects inside out
Results, valuation, peers and who's buying, in one view.
How did LCC Projects’ revenue and EBITDA change?
LCC Projects increased revenue from operations from Rs 2,438.9 crore in FY24 to Rs 3,600.3 crore in FY26, while EBITDA excluding other income rose from Rs 266 crore to Rs 481.7 crore. Revenue recorded a 21.5% compound annual growth rate, compared with 34.6% for EBITDA, or earnings before interest, tax, depreciation and amortisation.
LCC Projects added Rs 479.4 crore of revenue in FY25 and a further Rs 682 crore in FY26. EBITDA increased by Rs 112.2 crore in FY25 and Rs 103.5 crore in FY26, while FY26 other income was Rs 39.2 crore and was excluded from the reported EBITDA measure.
LCC Projects reported Rs 1,688.3 crore of revenue and Rs 256.4 crore of EBITDA in H1FY27. As H1FY27 covers six months, the presentation does not provide a like-for-like full-year FY27 comparison, but it reported a 15.2% EBITDA margin for the period.
Why did LCC Projects’ EBITDA margin rise?
LCC Projects’ EBITDA margin increased by 2.5 percentage points to 13.4% in FY26 from 10.9% in FY24, after reaching 13% in FY25. The presentation reports the movement but does not identify a specific cause such as contract pricing, project mix or procurement savings.
Material consumed, including construction expenses, rose to Rs 2,947 crore in FY26 from Rs 2,069.7 crore in FY24. Employee expenses increased to Rs 131.2 crore from Rs 79.4 crore, and other expenses rose to Rs 40.4 crore from Rs 23.9 crore over the same period.
LCC Projects’ H1FY27 EBITDA margin of 15.2% was 1.8 percentage points above the FY26 figure. That half-year result does not establish a full-year FY27 margin, but it extends the reported progression from 10.9% in FY24 to 13.4% in FY26.
How much did LCC Projects’ PAT increase?
LCC Projects’ PAT rose by Rs 164.4 crore to Rs 286.4 crore in FY26 from Rs 122 crore in FY24, more than twice the FY24 amount. The presentation gives PAT a 53.2% compound annual growth rate for FY24 to FY26, above the reported growth rates for revenue and EBITDA.
PAT margin rose from 5% in FY24 to 7.7% in FY25 and 7.9% in FY26. Profit before tax increased from Rs 172.4 crore in FY24 to Rs 378.4 crore in FY26, while tax rose from Rs 50.4 crore to Rs 91.9 crore.
Finance cost increased to Rs 96.2 crore in FY26 from Rs 49.9 crore in FY24. The FY24 accounts included exceptional items of Rs 35.5 crore, while FY25 showed no exceptional items and FY26 recorded Rs 0.8 crore.
LCC Projects reported H1FY27 PAT of Rs 142.7 crore and a PAT margin of 8.4%. The margin was 0.5 percentage points above FY26’s 7.9%, although the Rs 142.7 crore result covers only the first half of FY27.
Got a follow-up? Ask IRIS
What did LCC Projects’ cash flow and balance sheet show?
LCC Projects generated Rs 158.4 crore of net cash from operating activities in FY26, compared with Rs 23.6 crore in FY25 and Rs 29.3 crore in FY24. Cash generated from operations was Rs 244.7 crore before direct taxes of Rs 86.3 crore and a Rs 237 crore working-capital outflow.
Investing activities used Rs 106.8 crore in FY26, compared with Rs 195.2 crore in FY25, while financing activities generated Rs 17.7 crore after generating Rs 252.5 crore a year earlier. Closing cash and cash equivalents rose to Rs 172.2 crore in FY26 from Rs 102.8 crore in FY25.
Total assets rose to Rs 2,447.5 crore at March 2026 from Rs 1,130 crore at March 2024. Trade receivables increased to Rs 455.8 crore from Rs 156.6 crore, inventories rose to Rs 247.9 crore from Rs 135.6 crore, and other current assets increased to Rs 635.8 crore from Rs 379.7 crore.
How did the IPO affect LCC Projects’ capital position?
LCC Projects’ net worth increased to Rs 1,267.2 crore in H1FY27 from Rs 888.4 crore in FY26 after the company raised Rs 258 crore through a fresh initial public offering, or IPO, issue during H1FY27. Total debt rose to Rs 884.5 crore from Rs 860.7 crore over the same period.
LCC Projects’ total debt-to-equity ratio declined to 0.70 times in H1FY27 from 0.97 times in FY26 and 1.23 times in FY25. Net worth had risen from Rs 382.8 crore in FY24 to Rs 605 crore in FY25 before reaching Rs 888.4 crore in FY26.
Return on equity was 32.3% in FY26, after 37% in FY25, and was reported at 23.9% in H1FY27. Return on capital employed was 27.2% in FY26 and 23.8% in H1FY27, compared with 27.6% in both FY24 and FY25.
Conclusion
LCC Projects combined a Rs 1,161.4 crore increase in revenue from FY24 to FY26 with faster growth in EBITDA and PAT. EBITDA margin rose by 2.5 percentage points and PAT margin increased by 2.9 percentage points, while the H1FY27 figures showed 15.2% EBITDA margin, 8.4% PAT margin and a 0.70-times debt-to-equity ratio.
The presentation does not disclose a financial target for FY27. The next disclosed execution milestones include expected completion of the Siddhi Bansagar project in 2027 and the Bishrampur Mining project in 2030, with original contract values of Rs 1,386.5 crore and Rs 669.3 crore, respectively.