










Mallcom long-term borrowings rise to Rs 28 crore in H1-FY27
Key highlights
- Mallcom’s long-term borrowings rose to Rs 28 crore in H1-FY27 from Rs 6.2 crore at FY26.
- Mallcom’s net debt-to-equity ratio increased to 0.41x in H1-FY27 from 0.37x at FY26.
- Mallcom’s current financial investments increased to Rs 36.4 crore from Rs 6 crore at FY26.
- Mallcom’s H1-FY27 EBITDA was Rs 28.9 crore, while EBITDA margin improved to 11.43% from 10.50%.
powered by IRIS
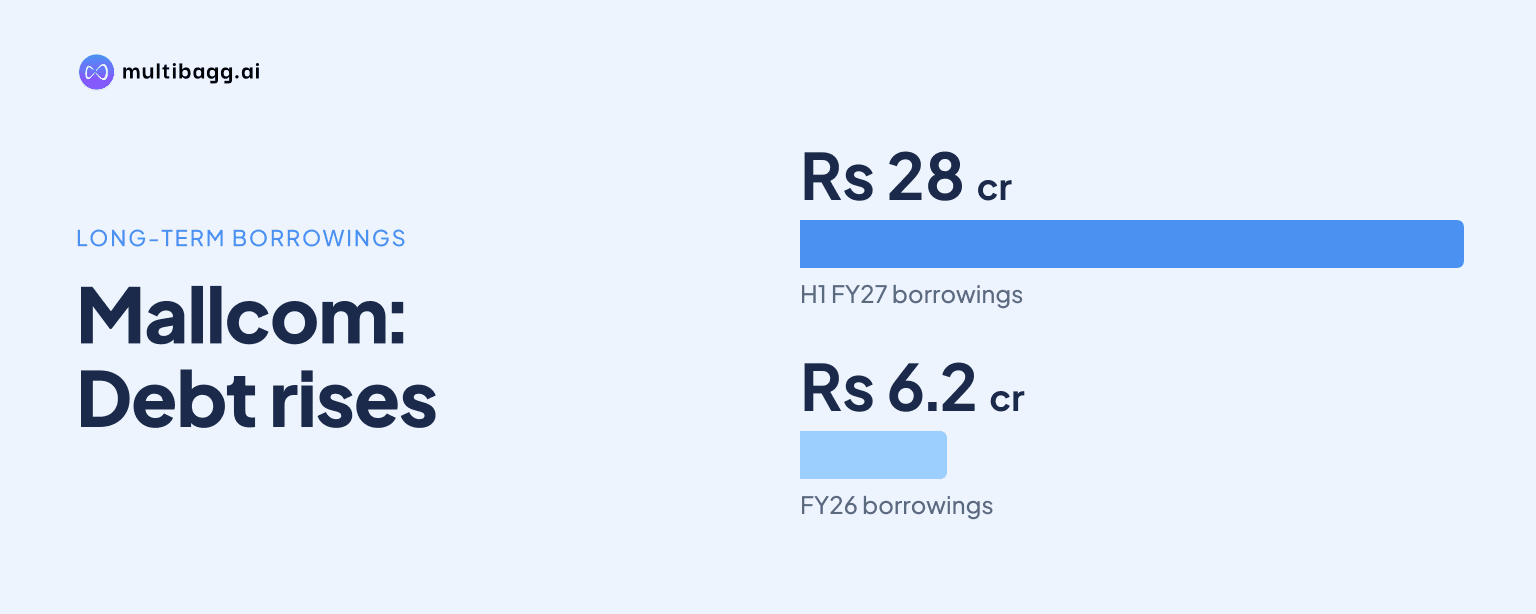
Mallcom (India) Ltd reported Rs 28 crore of long-term borrowings at H1-FY27, up from Rs 6.2 crore at FY26, while net debt-to-equity rose to 0.41x from 0.37x. The balance sheet also shows current investments increasing to Rs 36.4 crore, alongside Rs 331.1 crore of equity and Rs 556.6 crore of total assets.
Know Mallcom (India) inside out
Results, valuation, peers and who's buying, in one view.
What changed in Mallcom’s borrowings during H1-FY27?
Mallcom’s long-term borrowings rose by Rs 21.8 crore from the FY26 closing balance to Rs 28 crore in H1-FY27. The increase was concentrated in non-current funding: total non-current liabilities increased from Rs 10.7 crore at FY26 to Rs 34 crore at H1-FY27. Long-term borrowings were Rs 2.5 crore at FY25, making the H1-FY27 balance Rs 25.5 crore higher than two reporting periods earlier.
Short-term borrowings were broadly unchanged at Rs 113.9 crore in H1-FY27, versus Rs 114.1 crore at FY26 and Rs 113.3 crore at FY25. The borrowing mix therefore changed through longer-term obligations rather than a rise in short-term borrowings. The total borrowing figures below are calculated from Mallcom’s separately disclosed long- and short-term balances.
How did Mallcom’s leverage measure move?
Mallcom’s net debt-to-equity ratio increased to 0.41x in H1-FY27 from 0.37x in both FY25 and FY26. The presentation also reports 0.25x for FY24, making the H1-FY27 reading 0.16x above the FY24 level. This movement coincided with the rise in long-term borrowings, although the presentation does not provide a net-debt reconciliation or identify the cash and investment balances used in the ratio.
Equity increased to Rs 331.1 crore at H1-FY27 from Rs 318.4 crore at FY26 and Rs 298.6 crore at FY25. Other equity accounted for Rs 324.9 crore of the H1-FY27 equity balance, while equity share capital remained Rs 6.2 crore in FY25, FY26 and H1-FY27. Leverage therefore rose even as reported equity expanded by Rs 12.7 crore during the half-year.
Other liability balances also changed. Trade payables increased from Rs 44.1 crore at FY26 to Rs 51.3 crore at H1-FY27, while other current liabilities rose from Rs 20.6 crore to Rs 23.5 crore. Total current liabilities were Rs 191.5 crore at H1-FY27, compared with Rs 183.4 crore at FY26, while total non-current liabilities increased by Rs 23.3 crore to Rs 34 crore.
Where did Mallcom’s assets and investments increase?
Mallcom’s total assets increased by Rs 44.1 crore from FY26 to Rs 556.6 crore at H1-FY27, including a Rs 41.3 crore increase in current assets to Rs 324.3 crore. Current financial investments rose to Rs 36.4 crore from Rs 6 crore at FY26, an increase of Rs 30.4 crore. This was the largest disclosed movement among the individual current-asset lines over the period.
Inventories rose to Rs 147.4 crore at H1-FY27 from Rs 138.4 crore at FY26, while trade receivables increased to Rs 88.3 crore from Rs 86.2 crore. Cash and cash equivalents were Rs 4.5 crore, compared with Rs 3.8 crore at FY26, and other bank balances were Rs 1.2 crore against Rs 0.2 crore. Other current assets declined from Rs 48.2 crore to Rs 46 crore.
Non-current assets were Rs 232.3 crore in H1-FY27, Rs 2.8 crore above FY26. Property, plant and equipment increased from Rs 224.3 crore to Rs 226.7 crore, while non-current tax assets rose from Rs 3.6 crore to Rs 4.2 crore. Capital work in progress was Rs 74.3 crore in FY25 but was shown as nil in both FY26 and H1-FY27.
Got a follow-up? Ask IRIS
How do earnings and finance costs compare with the balance-sheet change?
Mallcom reported H1-FY27 operational income of Rs 252.8 crore, down 3.4% from Rs 261.8 crore in H1-FY26, while earnings before interest, tax, depreciation and amortisation (EBITDA) increased 5.1% to Rs 28.9 crore. EBITDA margin improved to 11.43% from 10.50%, and profit after tax increased to Rs 14.3 crore from Rs 13.6 crore. Finance cost declined to Rs 3.9 crore from Rs 4.1 crore in the half-year comparison.
The quarterly figures provide a different near-term comparison. In Q2-FY27, finance cost was Rs 2.3 crore, up from Rs 2.1 crore in Q2-FY26 and Rs 1.6 crore in Q1-FY27. Q2-FY27 operational income was Rs 143.3 crore, 2.9% above Q2-FY26, while EBITDA rose 53.5% to Rs 15.2 crore and EBITDA margin reached 10.61% from 7.11%.
On a full-year basis, finance cost increased from Rs 6.1 crore in FY25 to Rs 8.2 crore in FY26. FY26 profit after tax was Rs 30 crore, down from Rs 57.4 crore in FY25, while operational income increased from Rs 486.8 crore to Rs 539.6 crore. The presentation does not disclose an interest rate, debt maturity, repayment schedule, security detail or use for the additional long-term borrowing.
What happened to Mallcom’s reported return ratios?
Mallcom’s reported return on capital employed (ROCE) declined to 14.62% in FY26 from 16.90% in FY25 and 19.98% in FY24. Return on equity (ROE) was 9.42% in FY26, compared with 19.22% in FY25 and 15.28% in FY24. The presentation does not report H1-FY27 ROCE or ROE, leaving no disclosed half-year update for either annual ratio.
The FY26 ratio decline coincided with a change in annual profitability. EBITDA was Rs 60.5 crore in FY26, marginally below Rs 60.9 crore in FY25, and EBITDA margin fell to 11.21% from 12.51%. Profit after tax margin decreased to 5.56% in FY26 from 11.79% in FY25, while net worth was Rs 318.4 crore at FY26 and increased to Rs 331.1 crore at H1-FY27.
The next disclosure will clarify whether long-term borrowings remain near Rs 28 crore, how the Rs 36.4 crore current-investment balance changes, and whether net debt-to-equity moves from 0.41x. Mallcom has not disclosed a leverage target, return-ratio target, borrowing-reduction plan or stated deployment of the long-term funds in this presentation.
Conclusion
Mallcom’s H1-FY27 balance sheet shows a change in funding mix: long-term borrowings increased to Rs 28 crore while short-term borrowings stayed close to Rs 114 crore. At the same time, current investments rose by Rs 30.4 crore from FY26 to Rs 36.4 crore, total assets reached Rs 556.6 crore, and net debt-to-equity moved to 0.41x.
The next reporting update will show whether the H1-FY27 borrowing and investment position persists alongside earnings trends. H1-FY27 EBITDA margin was 11.43%, above 10.50% a year earlier, while FY26 ROCE and ROE were 14.62% and 9.42%, respectively; Mallcom has not disclosed targets for leverage or return ratios in this presentation.