










MPS lifts EBITDA margin to record 34.34% as revenue rises
Key highlights
- MPS reported a record 34.34% EBITDA margin in Q2 FY27, up from 31.10% in Q2 FY26.
- Q2 FY27 EBITDA rose 27.39% to Rs 77.03 crore, while revenue increased 15.35% to Rs 224.29 crore.
- H1 FY27 revenue was Rs 448.5 crore and EBITDA was Rs 154.0 crore, up 17.8% and 39.0% year on year.
- MPS had Rs 163.23 crore of cash and cash equivalents at 30 September 2026 and reported zero debt.
powered by IRIS
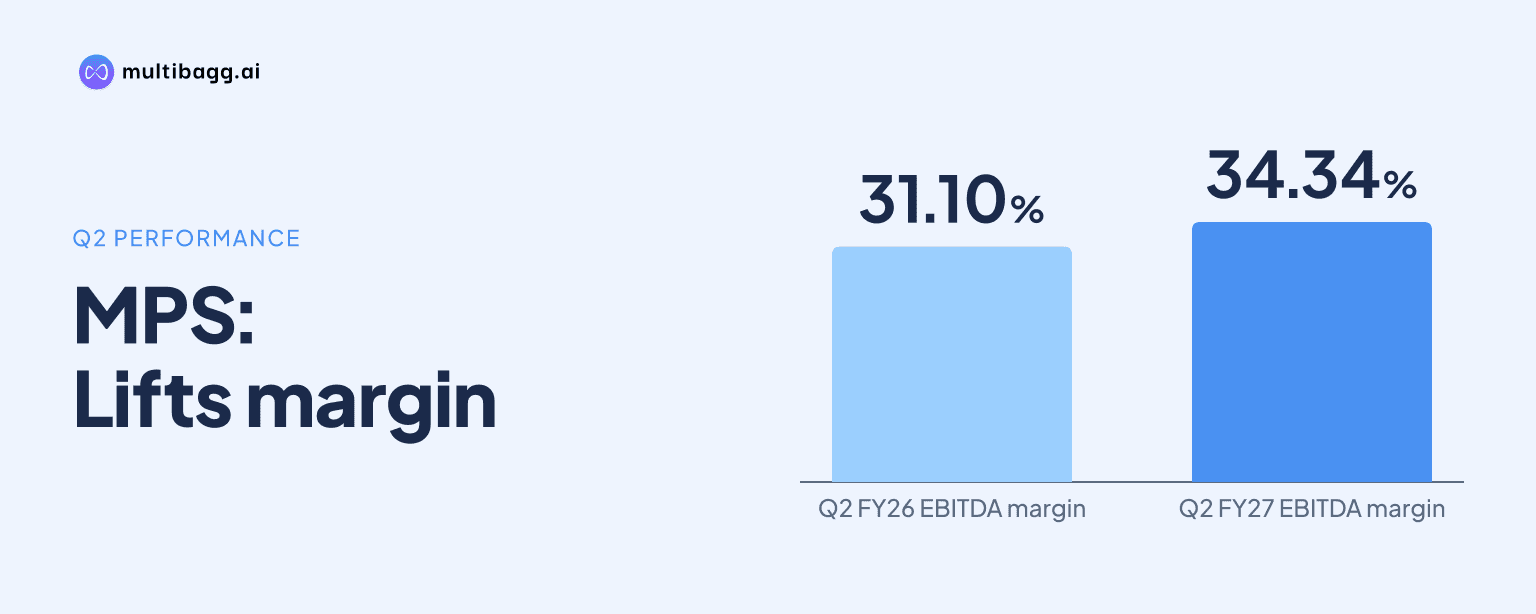
MPS Limited lifted its earnings before interest, tax, depreciation and amortisation (EBITDA) margin to a record 34.34% in Q2 FY27, from 31.10% a year earlier, as EBITDA rose 27.39% to Rs 77.03 crore while revenue grew 15.35% to Rs 224.29 crore. MPS also recorded an EBITDA margin above 34% for a second consecutive quarter.
Know MPS inside out
Results, valuation, peers and who's buying, in one view.
How did MPS lift EBITDA margin to a record level?
MPS lifted EBITDA margin by 3.24 percentage points year on year to 34.34% in Q2 FY27, its highest margin in company history. Revenue increased by Rs 29.85 crore from Rs 194.44 crore in Q2 FY26 to Rs 224.29 crore, while EBITDA increased by Rs 16.56 crore from Rs 60.47 crore to Rs 77.03 crore. EBITDA therefore expanded faster than revenue, at 27.39% against 15.35%.
The Q2 FY27 result followed a 34.32% EBITDA margin in Q1 FY27, when revenue was Rs 224.24 crore and EBITDA was Rs 76.96 crore. Revenue rose 0.02% sequentially to Rs 224.29 crore, while EBITDA increased 0.09% to Rs 77.03 crore. The margin moved 0.02 percentage points quarter on quarter, indicating that MPS maintained the higher level across both FY27 quarters disclosed.
What did MPS report for first-half profitability?
MPS reported H1 FY27 revenue of Rs 448.5 crore and EBITDA of Rs 154.0 crore, representing year-on-year growth of 17.8% and 39.0%, respectively. The 21.2-percentage-point gap between the growth rates extended the quarterly pattern in which EBITDA increased faster than sales. The presentation characterises this trend as earnings growing faster than revenue.
Over the six quarters from Q1 FY26 to Q2 FY27, MPS revenue rose 20.4%, from Rs 186.3 crore to Rs 224.3 crore, whereas EBITDA rose 53.2%, from Rs 50.3 crore to Rs 77.0 crore. EBITDA margin moved from 27.0% in Q1 FY26 to 34.3% in Q2 FY27, an increase of 7.3 percentage points. The margin was 31.1% in Q2 FY26, 31.6% in Q3 FY26 and 32.9% in Q4 FY26 before exceeding 34% in both FY27 quarters disclosed.
What does MPS's Q2 operating leverage comparison show?
MPS reported operating leverage in Q2 FY27 because revenue grew 15.35%, EBITDA grew 27.39%, and headcount grew 11.16% year on year. Headcount rose to 3,557 from 3,200 in Q2 FY26, an increase of 357 employees. EBITDA growth therefore exceeded both reported revenue growth and headcount growth in the period.
Sequentially, headcount rose more rapidly than revenue in Q2 FY27. Headcount increased 6.12% from 3,352 in Q1 FY27 to 3,557, while reported revenue edged up 0.02% and EBITDA increased 0.09%. EBITDA margin was 34.34% in Q2 FY27 versus 34.32% in Q1 FY27, leaving the margin nearly unchanged despite the quarter-on-quarter headcount increase.
Got a follow-up? Ask IRIS
Why did MPS's reported profit after tax fall year on year?
MPS's reported profit after tax (PAT) fell 6.04% to Rs 52.10 crore in Q2 FY27 from Rs 55.44 crore in Q2 FY26 because the earlier quarter included Rs 12.81 crore of one-time net exceptional income. The income resulted from a liability write-back on the 100% acquisition of Liberate Group. The PAT comparison therefore differs from the pre-tax measure excluding exceptional items.
Profit before tax (PBT), excluding exceptional items, rose 23.14% to Rs 69.40 crore in Q2 FY27 from Rs 56.36 crore a year earlier. It was 0.62% below Rs 69.83 crore in Q1 FY27. Basic earnings per share were Rs 30.70 in Q2 FY27, down 6.03% from Rs 32.67 in Q2 FY26 but up 3.37% from Rs 29.70 in Q1 FY27; diluted earnings per share were Rs 30.64, Rs 32.64 and Rs 29.69, respectively.
How did MPS's balance sheet position change in Q2 FY27?
MPS had cash and cash equivalents of Rs 163.23 crore at 30 September 2026 and reported zero debt after fully prepaying borrowings taken for the Unbound Medicine acquisition in August 2026. The presentation identifies the repayment as complete rather than as a future repayment target. It separately reports Q2 FY27 EBITDA of Rs 77.03 crore and PAT of Rs 52.10 crore.
The presentation provides no numerical revenue, EBITDA, margin or profit target beyond the Q2 FY27 and H1 FY27 results. It does disclose that Q2 FY26 included Rs 12.81 crore of exceptional income, affecting the year-on-year PAT and earnings-per-share comparisons. For the operating comparison excluding that item, PBT increased 23.14% year on year, compared with the 6.04% decline in reported PAT.
Conclusion
MPS's Q2 FY27 result combined a record 34.34% EBITDA margin with EBITDA growth of 27.39%, ahead of revenue growth of 15.35%. The same relationship appeared in H1 FY27, when EBITDA rose 39.0% and revenue increased 17.8%, while the six-quarter margin increased from 27.0% in Q1 FY26 to 34.3% in Q2 FY27.
The next results will clarify whether MPS can maintain an EBITDA margin above 34% after recording 34.32% in Q1 FY27 and 34.34% in Q2 FY27. Management did not disclose a numerical revenue, EBITDA or margin target, while the Q2 FY26 comparison will continue to reflect the Rs 12.81 crore exceptional income from the Liberate Group liability write-back.