










MTF FY26 operating cash flow turned negative as profit rose
Key highlights
- MTF’s operating cash flow changed from a Rs 1.8717 crore FY25 inflow to a Rs 96.34 lakh FY26 outflow.
- MTF’s FY26 revenue reached Rs 95.5475 crore and PAT reached Rs 12.3644 crore.
- MTF’s FY26 inventories increased by Rs 13.8871 crore to Rs 32.2978 crore.
- MTF’s FY26 trade receivables increased by Rs 11.6021 crore to Rs 26.2843 crore.
powered by IRIS
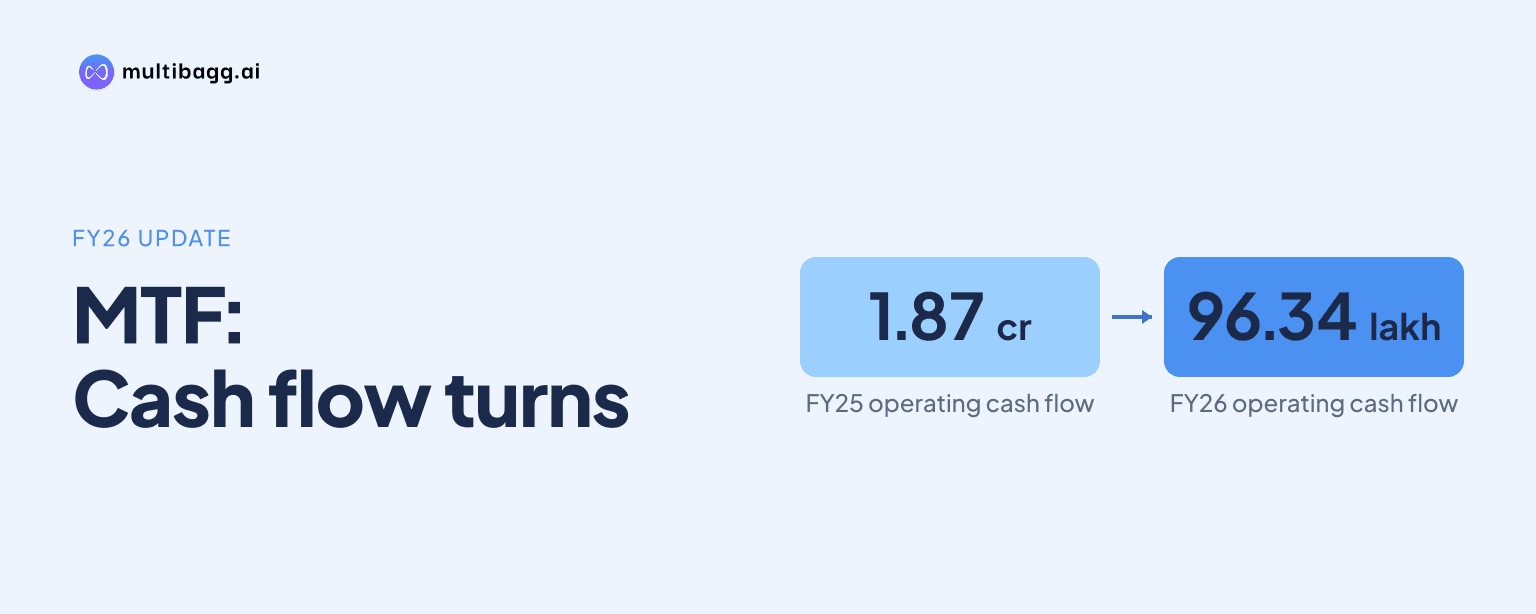
Metalic Technoforge Limited recorded a Rs 96.34 lakh operating cash outflow in FY26 despite revenue from operations rising to Rs 95.5475 crore and profit after tax reaching Rs 12.3644 crore. MTF’s inventories and trade receivables increased by a combined Rs 25.4892 crore during the year, alongside the cash-flow reversal.
Know Metalic Technoforge inside out
Results, valuation, peers and who's buying, in one view.
How did MTF’s operating cash flow change in FY26?
MTF’s net cash flow from operating activities changed from an inflow of Rs 1.8717 crore in FY25 to an outflow of Rs 96.34 lakh in FY26. The company had also reported an operating cash inflow of Rs 2.0481 crore in FY24, making FY26 the only negative operating-cash-flow year in the three-year presentation.
The reversal occurred while reported earnings increased. Revenue from operations rose by Rs 21.1753 crore from Rs 74.3722 crore in FY25 to Rs 95.5475 crore in FY26. Earnings before interest, tax, depreciation and amortisation, or EBITDA, increased to Rs 21.9475 crore from Rs 16.0766 crore, and its margin increased to 22.97% from 21.62%.
Profit after tax, or PAT, rose to Rs 12.3644 crore in FY26 from Rs 9.0281 crore in FY25, while the PAT margin increased to 12.94% from 12.14%. Revenue had risen from Rs 50.8509 crore in FY24, and PAT from Rs 4.2641 crore, but operating cash moved in the opposite direction from a Rs 2.0481 crore inflow in FY24 to the FY26 outflow.
What balance-sheet movements accompanied MTF’s cash outflow?
MTF’s FY26 cash outflow coincided with a significant increase in inventories and trade receivables. Inventories rose by Rs 13.8871 crore to Rs 32.2978 crore, while trade receivables increased by Rs 11.6021 crore to Rs 26.2843 crore. Together, these two balances increased by Rs 25.4892 crore from FY25.
Short-term loans and advances also rose to Rs 7.153 crore in FY26 from Rs 5.6761 crore in FY25. Total current assets therefore increased by Rs 27.0117 crore, exceeding the Rs 14.5835 crore increase in total current liabilities. The difference between current assets and current liabilities expanded to Rs 17.1169 crore from Rs 4.6887 crore.
The presentation does not provide a reconciliation from PAT to operating cash flow or assign a precise cash effect to individual working-capital items. The reported balance-sheet movements nevertheless show that a larger amount of funds was represented by inventories, receivables and advances at the end of FY26 than a year earlier.
Did higher supplier credit offset MTF’s inventory and receivables growth?
MTF’s trade payables increased in FY26, but by less than inventories and receivables. Trade payables rose by Rs 3.8876 crore to Rs 21.9165 crore, compared with the Rs 25.4892 crore increase in the combined inventory and receivables balance.
Other current liabilities also increased, though on a smaller scale. Short-term provisions rose by Rs 3.0815 crore to Rs 3.1472 crore, and other current liabilities increased by Rs 19.95 lakh to Rs 69.30 lakh. The presentation does not disclose supplier payment terms, receivable ageing or collection periods, so it does not establish the timing behind these movements.
The profit and loss statement reports a negative change in inventories of Rs 12.5201 crore in FY26, compared with a negative Rs 6.6048 crore in FY25. Cost of material consumed increased to Rs 56.7974 crore from Rs 42.6823 crore. These income-statement figures show a larger inventory-related movement, but they are not a cash-flow reconciliation.
Got a follow-up? Ask IRIS
How did investing and financing cash flows affect MTF’s cash balance?
MTF’s net cash used in investing activities declined to Rs 4.1173 crore in FY26 from Rs 17.5778 crore in FY25. Net cash generated from financing activities was Rs 5.1263 crore, compared with Rs 15.6914 crore in FY25, helping offset both the operating outflow and investing cash use.
As a result, closing cash and cash equivalents increased by Rs 4.56 lakh to Rs 36.14 lakh in FY26 from Rs 31.58 lakh in FY25. The cash-flow statement reports aggregate investing and financing categories only, and does not identify individual transactions that generated the FY26 financing inflow.
The balance sheet records a change in the funding mix. Short-term borrowings increased by Rs 7.4149 crore to Rs 23.2229 crore, while long-term borrowings declined by Rs 3.6085 crore to Rs 8.5581 crore. Shareholders’ equity increased to Rs 33.4157 crore from Rs 17.4013 crore, as equity share capital rose to Rs 17.4964 crore and reserves and surplus declined to Rs 15.9193 crore.
What does MTF’s FY26 result show about profit and cash conversion?
MTF’s FY26 figures show that its higher reported profit did not translate into positive operating cash flow in the same year. PAT increased by Rs 3.3363 crore, while operating cash flow changed by Rs 2.8351 crore from a FY25 inflow of Rs 1.8717 crore to a FY26 outflow of Rs 96.34 lakh.
Depreciation rose to Rs 4.415 crore from Rs 2.6029 crore, while other income increased to Rs 2.4357 crore from Rs 1.2651 crore. Profit before tax increased to Rs 17.6311 crore from Rs 12.5919 crore, and tax rose to Rs 5.2667 crore from Rs 3.5638 crore. The supplied cash-flow statement does not quantify how these items affected operating cash.
MTF’s total assets increased to Rs 92.0861 crore in FY26 from Rs 65.0987 crore in FY25, led by current assets. The presentation does not disclose inventory composition, receivable ageing, a working-capital plan or an operating-cash-flow target, leaving the drivers and expected duration of the FY26 cash-flow gap unresolved.
Conclusion
MTF reported higher FY26 revenue, EBITDA and PAT, but operating cash flow turned negative as current assets grew faster than current liabilities. Inventories and trade receivables increased by Rs 25.4892 crore, while trade payables increased by Rs 3.8876 crore. Financing cash inflow and lower investing cash use allowed closing cash to increase by Rs 4.56 lakh.
The next disclosures to watch are inventories, receivables and operating cash flow relative to revenue growth after FY26. MTF’s H1 FY27 investor presentation does not disclose a cash-flow target, receivable ageing schedule, working-capital plan or reconciliation of PAT to operating cash flow, leaving those matters unresolved.