










Navneet H1 revenue rises 7% as EBITDA margin falls 2.8 points
Key highlights
- Navneet’s standalone H1 FY27 revenue rose to Rs 1,109 crore from Rs 1,038 crore.
- Navneet’s H1 FY27 EBITDA declined to Rs 224 crore from Rs 239 crore, and EBITDA margin fell to 20.2% from 23.0%.
- Navneet’s domestic stationery revenue rose to Rs 198 crore in H1 FY27 from Rs 154 crore, while export stationery fell to Rs 366 crore from Rs 373 crore.
- Navneet’s Q2 FY27 standalone revenue was Rs 324 crore and EBITDA was Rs 20 crore, versus Rs 246 crore and Rs 8 crore a year earlier.
powered by IRIS
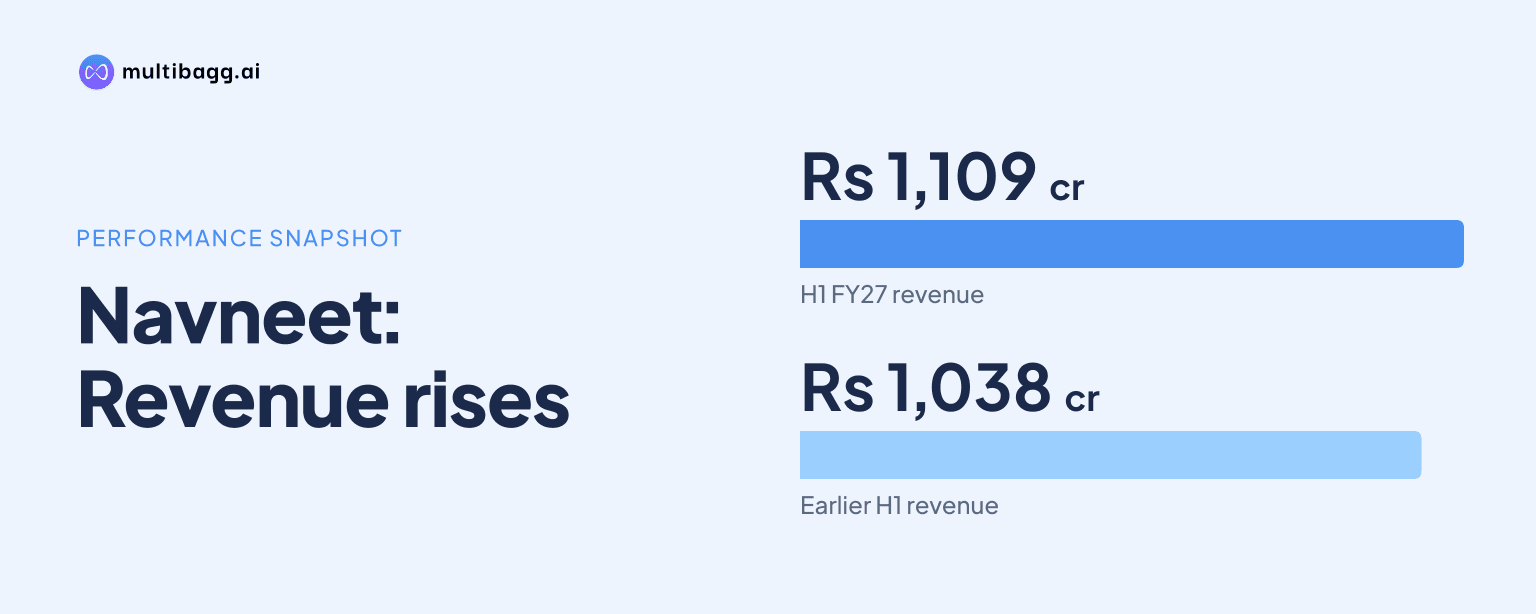
Navneet Education Limited reported standalone revenue of Rs 1,109 crore in the first half of fiscal year 2027 (H1 FY27), up 6.8% from Rs 1,038 crore, while earnings before interest, tax, depreciation and amortisation (EBITDA) fell Rs 15 crore to Rs 224 crore and its margin declined to 20.2% from 23.0%.
Know Navneet Education inside out
Results, valuation, peers and who's buying, in one view.
How did Navneet’s H1 FY27 standalone performance change?
Navneet’s revenue increased Rs 71 crore in H1 FY27, but EBITDA and profit before tax (PBT) both declined from H1 FY26. EBITDA was Rs 224 crore against Rs 239 crore a year earlier, while PBT was Rs 203 crore compared with Rs 208 crore. The presentation provides the reported outcomes but no expense-line bridge explaining the EBITDA decline.
The EBITDA margin decreased by 2.8 percentage points to 20.2% in H1 FY27 from 23.0% in H1 FY26. PBT margin also fell, to 18.3% from 20.0%, a 1.7-percentage-point change. Thus, the increase in standalone sales did not result in higher reported EBITDA or PBT for the half year.
Why was Navneet’s Q2 result better than its H1 trend?
Navneet’s standalone second quarter of fiscal year 2027 (Q2 FY27) revenue rose 31.7% to Rs 324 crore from Rs 246 crore in Q2 FY26, and EBITDA increased to Rs 20 crore from Rs 8 crore. Quarterly EBITDA margin rose to 6.2% from 3.3%, while PBT turned positive at Rs 3 crore after a Rs 8 crore loss before tax a year earlier.
Management said publications revenue in Q2 FY27 rose 53.8% to Rs 140 crore from Rs 91 crore mainly because revenue from the first quarter spilled into the second quarter. That timing effect contrasts with H1 FY27 publications revenue growth of 6.7%, to Rs 544 crore from Rs 510 crore, and explains why the Q2 comparison was faster than the half-year comparison.
Q2 FY27 PBT included Rs 2.3 crore, net of expenses, as Navneet’s share of a fair-value gain on the K12 by NLLP investment. It also included Rs 0.5 crore of fair value related to investments in CP Capital and Career Point Edutech. These disclosed items accompanied the reported Rs 3 crore Q2 PBT figure.
Which Navneet segments drove H1 FY27 revenue?
Domestic stationery delivered the largest absolute increase among Navneet’s reported H1 segments, rising Rs 44 crore to Rs 198 crore from Rs 154 crore. Publications added Rs 34 crore to reach Rs 544 crore from Rs 510 crore. These increases outweighed a Rs 7 crore fall in export stationery revenue to Rs 366 crore.
Export stationery was the only reported H1 segment to decline, falling from Rs 373 crore in H1 FY26 to Rs 366 crore in H1 FY27. Management said exports had shown signs of revival, but described a U-shaped recovery as conditional on supply-chain disruptions, geopolitical challenges and weakening global demand becoming more favourable for exporters.
All three reported segments grew in Q2 FY27. Publications rose to Rs 140 crore from Rs 91 crore, domestic stationery reached Rs 52 crore from Rs 38 crore, and export stationery increased to Rs 132 crore from Rs 117 crore. Management attributed domestic stationery growth to branding and non-paper stationery, and said it planned further penetration through customer-centric products.
Got a follow-up? Ask IRIS
What does the curriculum-change cycle mean for Navneet?
Navneet expects the curriculum-change cycle that began in FY26 to continue for the next two financial years. Management said lower grades changed in FY26 and FY27 and that higher grades are expected to change next. According to management, higher grades account for a greater revenue share than lower grades.
The disclosed revenue pattern separates this longer cycle from the Q2 timing effect. Publications added Rs 49 crore year on year in Q2 FY27, partly because of the Q1 spillover, but added Rs 34 crore across H1 FY27. Navneet did not disclose a publication revenue target, segment EBITDA, publication margin or cost estimate for the anticipated higher-grade changes.
Management’s expectation therefore identifies a potential source of future publications revenue, rather than a quantified earnings forecast. The presentation gives no basis to determine whether the expected higher-grade cycle would reverse the H1 FY27 EBITDA decline of Rs 15 crore or the 2.8-percentage-point margin reduction.
How comparable is Navneet’s H1 PBT after exceptional items?
Navneet’s reported H1 FY27 PBT of Rs 203 crore included a Rs 10 crore reversal of provision for leave encashment following a change in wage definition. It also included Rs 2.3 crore, net of expenses, from the K12 by NLLP fair-value gain and Rs 5 crore of fair value related to CP Capital and Career Point Edutech investments.
The three disclosed H1 FY27 PBT items total Rs 17.3 crore. The presentation reports H1 FY26 PBT of Rs 208 crore but does not identify comparable exceptional items on that slide. It also does not provide adjusted PBT or an adjusted PBT margin after excluding the FY27 items.
EBITDA is presented separately from PBT and was Rs 224 crore in H1 FY27, compared with Rs 239 crore in H1 FY26. Since the presentation does not state whether the PBT items affected EBITDA, the reported EBITDA comparison and the reported PBT comparison should be considered as separate measures.
How did Navneet’s working-capital cycle move by September 2026?
Navneet’s receivable days increased to 55 in September 2026 from 52 in September 2025, while finished-goods inventory days rose to 97 from 88. The presentation labels these as trailing-12-month working-capital-cycle measures, so each date reflects the preceding 12 months.
Raw-material inventory days moved in the other direction, declining to 71 in September 2026 from 84 a year earlier. The presentation does not provide a combined cash-conversion-cycle figure, creditor days, operating cash flow or an explanation for the changes in receivables and inventory.
These working-capital data were presented alongside Q2 FY27 standalone revenue of Rs 324 crore and EBITDA of Rs 20 crore. They show changes in three operating categories, but do not establish cash generation, borrowing requirements or the value of working-capital balances from the material disclosed.
Conclusion
Navneet increased standalone H1 FY27 revenue to Rs 1,109 crore, supported by higher publications and domestic stationery revenue, but EBITDA fell to Rs 224 crore and margin declined to 20.2%. The stronger Q2 comparison included a publications revenue spillover from Q1, while export stationery remained below its H1 FY26 level.
The next disclosed development to watch is management’s plan for the curriculum-change cycle to continue for two financial years, with anticipated higher-grade changes carrying a larger revenue share. Export stationery is also relevant because management’s expected U-shaped recovery remains conditional on supply-chain conditions, geopolitical developments and global demand.