










Orient Bell GVT mix reaches 42% as vitrified sales hit 60%
Key highlights
- Orient Bell’s GVT sales mix increased from 16% in FY21 to 42% in FY26.
- Orient Bell’s vitrified-tile sales mix rose from 41% in FY21 to 60% in FY26.
- Orient Bell reported detailed FY26 EBITDA of Rs 42.5 crore, versus Rs 23.6 crore in FY24.
- Orient Bell’s FY26 revenue from operations was Rs 691.5 crore, up from Rs 669.7 crore in FY25.
powered by IRIS
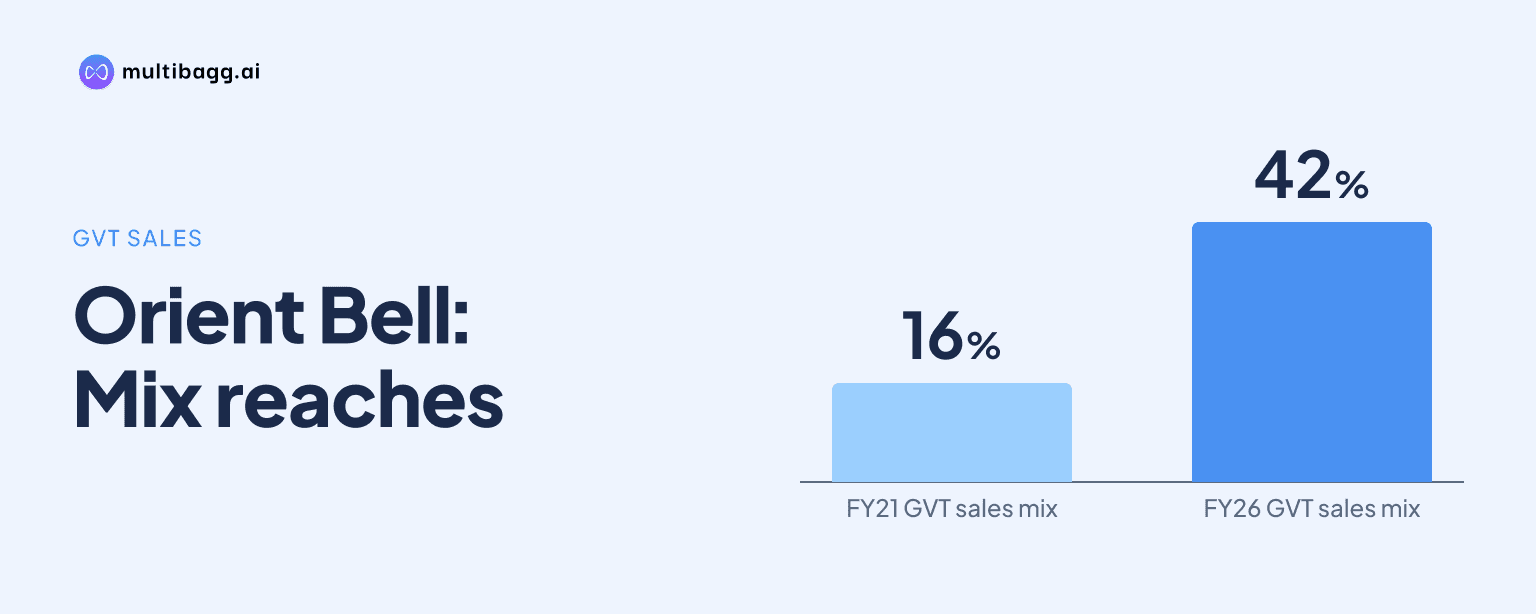
Orient Bell Limited lifted its glazed vitrified tile (GVT) sales mix to 42% in FY26 from 16% in FY21, while vitrified tiles reached 60% from 41%, according to its consolidated historical annual trends. Detailed FY26 earnings before interest, tax, depreciation and amortisation (EBITDA) were Rs 42.5 crore, up from Rs 23.6 crore in FY24.
Know Orient Bell inside out
Results, valuation, peers and who's buying, in one view.
How did Orient Bell’s tile sales mix change from FY21 to FY26?
Orient Bell increased both reported sales-mix measures over the FY21-to-FY26 period. Vitrified-tile sales rose by 19 percentage points, from 41% in FY21 to 60% in FY26, while GVT sales rose by 26 percentage points, from 16% to 42%. GVT therefore exceeded twice its FY21 share by FY26.
The progression occurred in every reported year for GVT. Its share moved from 16% in FY21 to 20% in FY22, 23% in FY23, 30% in FY24, 41% in FY25 and 42% in FY26. Vitrified sales also rose each year, advancing from 41% to 43%, 45%, 51%, 59% and 60% over the same six-year series.
The largest annual increase in the reported GVT mix was 11 percentage points between FY24 and FY25, from 30% to 41%. The vitrified-sales mix had its largest increase in that same interval, rising 8 percentage points from 51% to 59%; it added a further 1 percentage point in FY26.
What does the FY26 sales-mix data establish about Orient Bell?
Orient Bell’s FY26 annual-trends page establishes that vitrified tiles represented 60% of sales and GVT represented 42% of sales. The presentation reports these as two sales-mix indicators but does not state whether they are overlapping or mutually exclusive categories, so their percentages should not be added to calculate a combined share.
The difference between the two reported measures narrowed to 18 percentage points in FY26, from 25 percentage points in FY21. That reflects the faster five-year increase in GVT, at 26 percentage points, relative to the 19-percentage-point rise in vitrified sales. The presentation does not provide a category definition beyond the GVT label.
Orient Bell does not disclose revenue, volume, average selling price or margin by vitrified-tile or GVT category for FY26. As a result, the data show the direction and scale of the mix shift, but do not establish how much of Rs 691.5 crore in FY26 revenue from operations came from GVT or the profitability of either product category.
Got a follow-up? Ask IRIS
Did revenue rise as Orient Bell’s vitrified and GVT mix increased?
Orient Bell reported FY26 revenue from operations of Rs 691.5 crore, up Rs 21.8 crore from Rs 669.7 crore in FY25 and Rs 17.1 crore from Rs 674.4 crore in FY24. This followed a decline from Rs 705.1 crore in FY23 to Rs 674.4 crore in FY24, before the FY26 increase alongside the higher reported mix measures.
The annual-performance summary separately shows revenue of Rs 687 crore in FY26, Rs 667 crore in FY25 and Rs 670 crore in FY24. The detailed consolidated income statement shows Rs 691.5 crore of revenue from operations and Rs 3 crore of other income in FY26. These are separate reported lines, and the presentation does not specify which revenue line underlies the sales-mix percentages.
Cost of goods sold declined to Rs 305.9 crore in FY26 from Rs 316.1 crore in FY25, while revenue from operations increased. The annual-trends page reports gross margin of 36.0% in both FY25 and FY26, compared with 35.0% in FY24; it defines gross margin as sales less cost of goods sold, including material consumed, inventory change, purchases, power and fuel.
How did Orient Bell’s profitability change after FY24?
Orient Bell’s detailed consolidated EBITDA rose to Rs 42.5 crore in FY26 from Rs 23.6 crore in FY24, while EBITDA margin increased to 6.2% from 3.5%. The intervening FY25 result was Rs 30.8 crore and 4.6%, respectively, showing improvement in both measures over two years.
FY26 EBITDA remained below Rs 58.7 crore in FY22 and Rs 52.8 crore in FY23, when EBITDA margins were 9.0% and 7.5%, respectively. It was, however, above the Rs 37.1 crore reported in FY21. The annual-performance page presents rounded FY26 EBITDA of Rs 43 crore and a 6.4% margin, whereas the detailed income statement records Rs 42.5 crore and 6.2%.
Profit before tax (PBT) rose to Rs 16.3 crore in FY26 from Rs 3.8 crore in FY25 and Rs 1.2 crore in FY24. Profit after tax (PAT) increased to Rs 12.4 crore from Rs 2.8 crore in FY25, lifting PAT margin to 1.8% from 0.4%; FY24 PAT was Rs 0.9 crore with a 0.1% margin.
Below EBITDA, interest expense declined to Rs 3.6 crore in FY26 from Rs 4.8 crore in FY25, while depreciation was Rs 22.3 crore versus Rs 22.5 crore. The FY26 income statement also records an exceptional item of negative Rs 1.3 crore, meaning the movement from EBITDA to PAT cannot be assigned to the sales-mix data alone.
Conclusion
Orient Bell’s historical figures show a substantial change in its reported product mix between FY21 and FY26: vitrified sales rose from 41% to 60%, and GVT sales increased from 16% to 42%. Over the recovery from FY24, revenue from operations increased from Rs 674.4 crore to Rs 691.5 crore, while detailed EBITDA rose from Rs 23.6 crore to Rs 42.5 crore.
The next disclosures to watch are category-level revenue, volume, pricing and margin data, because the presentation provides no GVT or vitrified-tile profitability measure or future mix target. The unresolved link is whether the FY26 GVT share of 42% and vitrified share of 60% can be connected to future earnings, particularly as FY26 EBITDA of Rs 42.5 crore remained below the Rs 58.7 crore reported in FY22.