










orientbell tiles Q2 EBITDA rises 129% as margin reaches 9.8%
Key highlights
- OBL reported Q2FY27 EBITDA of Rs 22.4 crore, up 129.0% year-on-year.
- Q2FY27 revenue from operations rose 38.7% to Rs 229.0 crore and tile volume grew 14.6% to 67 lakh square metres.
- EBITDA margin expanded by 380 basis points to 9.8% in Q2FY27 from 6.0% in Q2FY26.
- OBL had negative net debt of Rs 48.8 crore and an 18-day working-capital cycle at 30 September 2026.
powered by IRIS
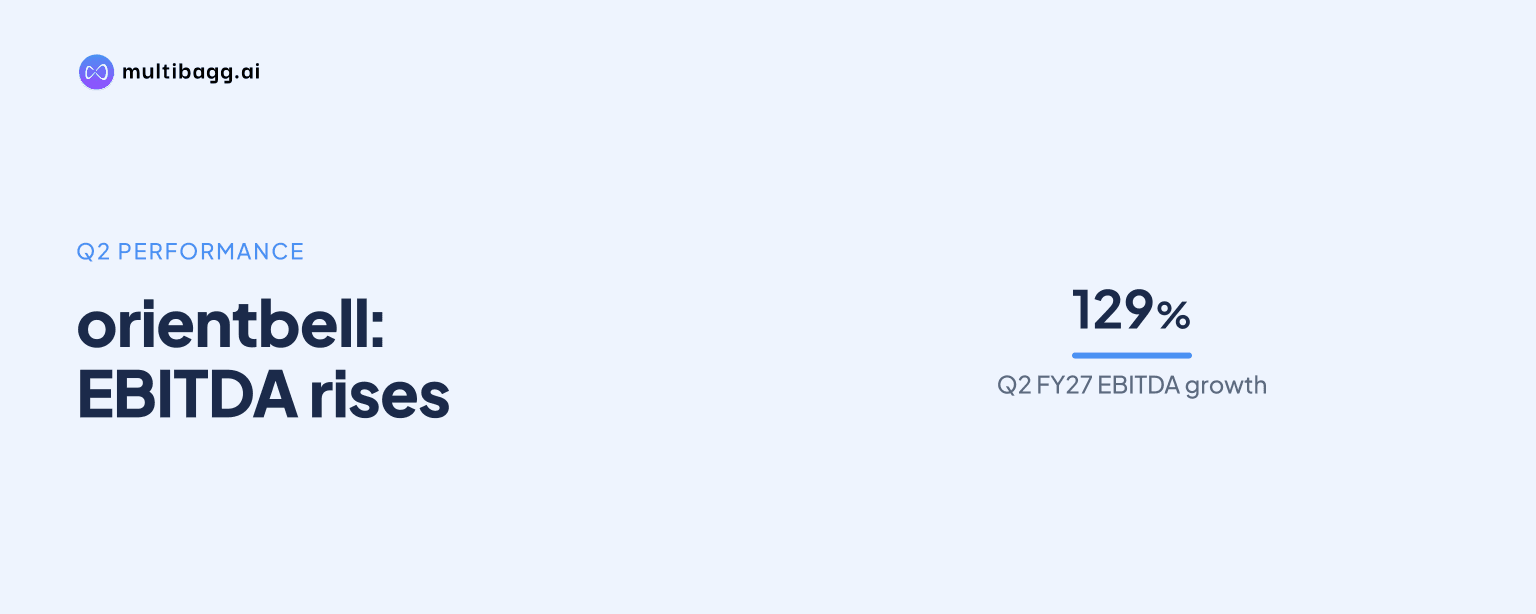
orientbell tiles reported Q2FY27 EBITDA of Rs 22.4 crore, up 129.0% year-on-year, as revenue from operations increased 38.7% to Rs 229.0 crore and EBITDA margin expanded by 380 basis points to 9.8%. The company attributed the faster profit growth to operating leverage, cost control, higher average selling prices and a richer product mix.
Know Orient Bell inside out
Results, valuation, peers and who's buying, in one view.
How did OBL's sales performance change in Q2FY27?
OBL increased Q2FY27 tile volume by 14.6% year-on-year to 67 lakh square metres, while revenue from operations rose 38.7% to Rs 229.0 crore. Revenue therefore grew faster than volume during the quarter, alongside management's reported increase in average selling prices and premium product mix.
The financial-highlights slide reports quarterly revenue of Rs 228 crore in Q2FY27, after Rs 203 crore in Q1FY27 and Rs 213 crore in Q4FY26, making it the third consecutive quarter above Rs 200 crore. The abridged income statement separately reports revenue from operations of Rs 229.0 crore in Q2FY27, compared with Rs 165.1 crore in Q2FY26.
OBL's sales mix moved further towards categories it identifies as premium. Vitrified tiles represented 59% of Q2FY27 sales, up from 58% a year earlier, while glazed vitrified tiles, or GVT, accounted for 45%, compared with 41% in Q2FY26. Management cited this mix shift as one contributor to the revenue and margin performance.
Why did OBL's EBITDA outpace revenue in Q2FY27?
OBL's EBITDA, or earnings before interest, tax, depreciation and amortisation, rose 129.0% to Rs 22.4 crore because operating expenses increased 18.3% to Rs 63.9 crore, slower than the 38.7% rise in revenue from operations. EBITDA margin consequently reached 9.8% from 6.0% in Q2FY26.
Cost of goods sold rose 40.9% to Rs 141.3 crore, slightly faster than revenue, and gross margin declined to 37.9% from 38.9%. Gross profit still increased by Rs 22.5 crore to Rs 86.3 crore, while operating expenses rose by Rs 9.9 crore, leaving a larger portion of gross profit as EBITDA.
Management attributed the margin expansion to higher average selling prices, richer product mix and disciplined cost optimisation. It reported that cost of production was 2.1% higher year-on-year on a like-for-like basis, which it defines at constant product mix and energy cost, and said an alternate-material strategy helped manage cost increases. Marketing investment remained 3.6% of sales in Q2FY27.
How did OBL's pretax and net profit move in Q2FY27?
OBL's profit before tax, or PBT, increased 326.1% year-on-year to Rs 16.4 crore in Q2FY27, while profit after tax, or PAT, rose 288.6% to Rs 12.4 crore. PBT margin increased to 7.2% from 2.3%, and PAT margin rose to 5.4% from 1.9%.
Depreciation was broadly unchanged at Rs 5.4 crore, while financial charges fell 34.8% to Rs 0.6 crore from Rs 1.0 crore. Earnings before interest and tax rose 287.0% to Rs 17.1 crore, although the share of profit or loss of associates moved from Rs 0.4 crore to nil.
Tax expense increased to Rs 4.0 crore from Rs 0.7 crore as pretax profit increased. PAT grew by Rs 9.2 crore from Rs 3.2 crore in Q2FY26, while management described PBT as having grown fourfold to Rs 16.4 crore.
Got a follow-up? Ask IRIS
What did OBL report for first-half profitability?
OBL reported 1HFY27 EBITDA of Rs 40.0 crore, up 160.5% year-on-year, on revenue from operations of Rs 433.2 crore, up 40.2%. First-half EBITDA margin expanded to 9.3% from 5.0%, while PBT rose 740.9% to Rs 27.6 crore.
The comparison with 1HFY26 shows EBITDA of Rs 15.4 crore on Rs 308.0 crore of revenue from operations. Unlike the Q2 gross-margin movement, first-half gross margin improved to 38.8% from 37.8%, while operating expenses rose 26.5% to Rs 126.9 crore, below the pace of revenue growth.
PAT for 1HFY27 was Rs 20.7 crore, compared with Rs 2.8 crore in 1HFY26, an increase of 636.2%. The first-half PAT margin rose to 4.8% from 0.9%, while tax expense increased to Rs 6.9 crore from Rs 0.5 crore.
How did OBL's debt and working capital position change?
OBL had negative net debt of Rs 48.8 crore at 30 September 2026, compared with negative Rs 29.7 crore at 31 March 2026. Cash and cash equivalents including short-term investments were Rs 71.7 crore in the debt presentation, while total borrowings declined to Rs 22.9 crore from Rs 29.7 crore.
The working-capital cycle was 18 days at 30 September 2026, unchanged from 30 June 2026 and down from 20 days at 31 March 2026. Days sales outstanding, or DSO, remained at 43 days in September and June, compared with 48 days at the March year-end and 59 days at 31 March 2025.
OBL said it reduced absolute receivables despite sales growth of about 40%. Trade receivables were Rs 105.9 crore at 30 September 2026, down from Rs 112.7 crore at 31 March 2026, while inventories increased to Rs 78.6 crore from Rs 65.2 crore. Net worth increased to Rs 348.7 crore from Rs 328.8 crore over the same period.
Conclusion
OBL's Q2FY27 result combined 14.6% tile-volume growth with a 38.7% increase in revenue from operations and a 129.0% rise in EBITDA. Premium vitrified and GVT mix increased, operating expenses grew more slowly than revenue, and EBITDA margin reached 9.8%, while lower financial charges also supported PBT of Rs 16.4 crore and PAT of Rs 12.4 crore.
The next reporting periods will show whether OBL can sustain its Q2FY27 margin while like-for-like cost of production was 2.1% higher year-on-year. Management's disclosed approach includes continued marketing investment of 3.6% of sales, premiumisation and technology-enabled platforms, while the 18-day working-capital cycle and negative Rs 48.8 crore net debt remain measures to monitor.