










PNB Q2 FY27 Profit Rises 12.8%, Asset Quality Improves
Key highlights
- PNB’s standalone net profit rose 12.8% year on year to Rs 5,532 crore in Q2 FY27 ended 30 September 2026.
- PNB’s net NPA ratio declined to 0.25% from 0.36% a year earlier, while its provision coverage ratio stood at 97.32%.
- Advances grew 14.7% year on year to Rs 13,41,194 crore, faster than the 9.9% increase in deposits to Rs 17,77,240 crore.
- PNB’s CRAR improved to 17.95% from 17.19% a year earlier, and tangible book value per share rose to Rs 111.94 from Rs 95.92.
powered by IRIS
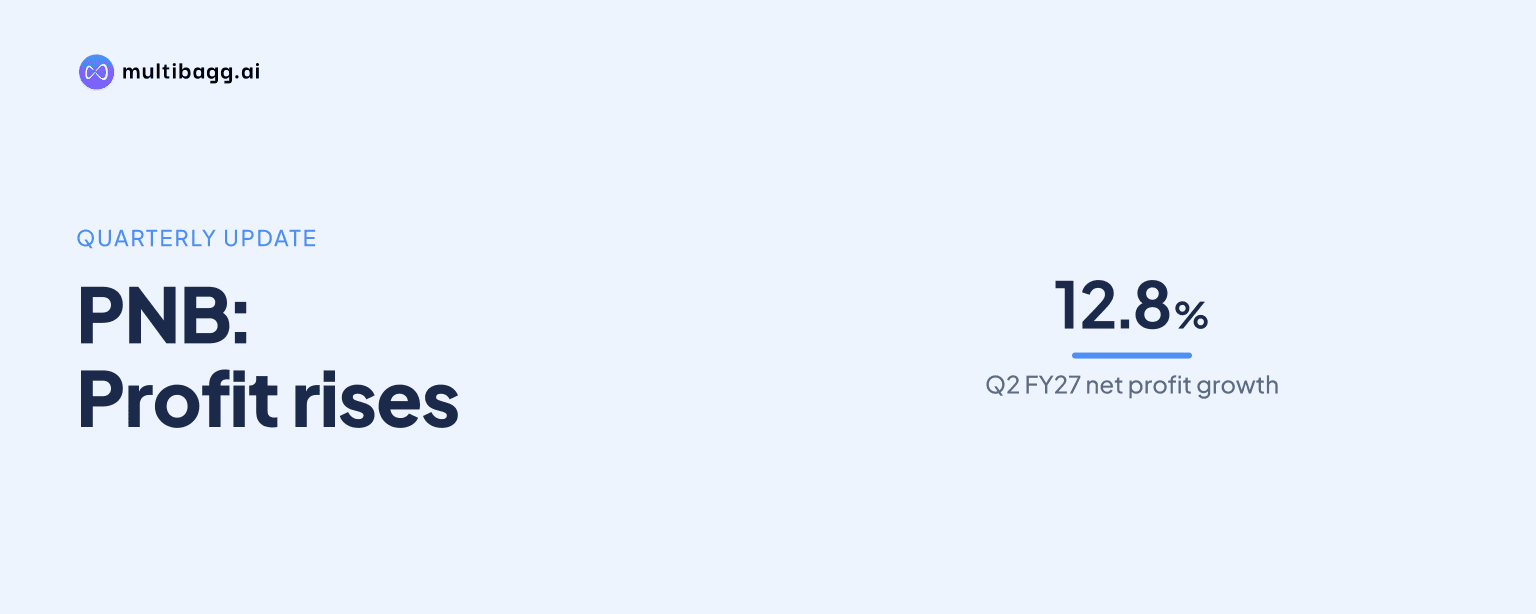
Punjab National Bank reported a 12.8% year-on-year increase in standalone net profit to Rs 5,532 crore for the quarter ended 30 September 2026. The public sector lender had reported a net profit of Rs 4,904 crore in the corresponding quarter of the previous year. The September-quarter result also showed improvement in asset quality, margins and capital adequacy. PNB announced the unaudited results on 16 October 2026. The results cover the second quarter and first half of FY27. The bank later released the transcript of its analyst and investor earnings call on 23 October 2026. PNB is India’s second-largest public sector lender by the description provided in the reported results.
Know Punjab National Bank inside out
Results, valuation, peers and who's buying, in one view.
Profit growth supported by higher income
PNB’s total income rose to Rs 38,185 crore in Q2 FY27 from Rs 36,214 crore a year earlier. Interest income increased to Rs 34,585 crore from Rs 31,872 crore during the same period. Operating profit rose to Rs 7,532 crore, compared with Rs 7,227 crore in Q2 FY26. The movement in income and operating profit accompanied the increase in net profit. Return on assets remained unchanged at 1.05% in Q2 FY27, matching the level recorded a year earlier. This indicates that the bank maintained its reported profitability ratio while expanding earnings. The reported standalone numbers were the central focus of the quarterly announcement.
Asset quality ratios declined year on year
The bank’s gross non-performing asset ratio improved by 90 basis points year on year to 2.55% as of 30 September 2026. The GNPA ratio was 3.45% at the end of September 2025. Net non-performing assets declined by 11 basis points to 0.25% from 0.36%. These ratios measure stressed loans relative to the loan book after specified adjustments. The reduction in both GNPA and NNPA points to an improvement in the reported quality of PNB’s advances. Its provision coverage ratio stood at 97.32%, according to the quarterly information. Asset quality is closely monitored by bank investors because it affects provisions, profitability and capital deployment.
Net interest margin improved sequentially
PNB’s global net interest margin improved to 2.58% in Q2 FY27 from 2.50% in Q1 FY27. The 8-basis-point sequential increase is relevant because net interest margin tracks the spread between interest earned and interest paid relative to earning assets. Net interest income rose 10.8% year on year to Rs 11,601 crore in the September quarter. The rise in NII came alongside higher interest income. The data provided does not specify the individual drivers of the margin change. However, the reported improvement added to the quarter’s earnings profile. Investors will assess whether the margin level is maintained in subsequent quarters.
Business growth remained in double digits
PNB reported global business of Rs 31,18,434 crore, up 11.9% year on year. Deposits increased 9.9% to Rs 17,77,240 crore. Advances rose at a faster 14.7% pace to Rs 13,41,194 crore. Separately reported figures placed global business at Rs 31,19,790 crore and domestic business at Rs 29,70,279 crore, showing minor variation across disclosures. The core message across the reported data was that advances grew faster than deposits. PNB’s credit-deposit ratio rose to 75.5% at the end of September 2026 from 72.3% a year earlier. This ratio indicates a greater share of deposits was deployed as loans than in the previous year.
Capital and book value strengthened
The bank’s capital to risk-weighted assets ratio increased to 17.95% as of September 2026 from 17.19% a year earlier. A stronger CRAR provides capacity to support loan growth while meeting regulatory capital requirements. Tangible book value per share improved to Rs 111.94 in September 2026 from Rs 95.92 in September 2025. The year-on-year increase in this measure reflects a higher reported tangible net worth per share. These capital and book-value metrics provide additional context beyond quarterly profit. They are especially relevant for public sector bank valuations, where investors also monitor balance-sheet strength and asset quality.
Got a follow-up? Ask IRIS
Consolidated result also recorded growth
PNB reported consolidated net profit of Rs 5,898.37 crore for the September 2026 quarter, up 15.08% from Rs 5,125.28 crore in the year-earlier quarter. Consolidated total operating income rose 8.47% to Rs 35,267.24 crore from Rs 32,512.76 crore. The consolidated result includes the performance of subsidiaries, associates and other entities covered by consolidation. Reported market data separately stated consolidated revenue of Rs 38,791 crore and net profit of Rs 5,918 crore, but the bank’s reported consolidated result cited Rs 5,898.37 crore as net profit. The standalone profit figure of Rs 5,532 crore remains the figure highlighted in PNB’s quarterly release. Investors should distinguish between standalone and consolidated disclosures when comparing financial metrics.
Key Q2 FY27 financial metrics
Distribution network and operating reach
PNB had 53,672 total touch points as of 30 September 2026. Its network included 10,481 domestic branches and two international branches. This physical reach remains important for a public sector lender with a large deposit and lending franchise. The bank also reported improvements in business per employee and business per branch, though the figures were not specified in the supplied data. Distribution capacity can support deposit mobilisation, credit delivery and customer servicing across regions. The reported business growth was achieved within this large branch-led network. The bank’s operating reach therefore remains a material part of its business model.
Market relevance and next disclosures
PNB shares reportedly rose after the lender announced the quarterly numbers, although no share-price movement was provided. The result combined 12.8% standalone profit growth with lower bad-loan ratios and a sequential improvement in global net interest margin. The faster growth in advances relative to deposits also lifted the credit-deposit ratio. Analysts cited in the supplied material modestly raised their price target to Rs 101.64 from Rs 96.17, based on updated assumptions including fair value, discount rate, revenue growth, profit margin and future price-to-earnings multiples. Such estimates are analyst assessments rather than bank guidance. PNB’s next quarterly disclosures will show whether income growth, margins and asset-quality improvements continue through the remaining periods of FY27.
Conclusion
PNB’s Q2 FY27 results showed higher standalone profit, rising income and improved reported asset quality. The bank also recorded higher capital adequacy, tangible book value and global business. Its next financial update will provide further information on loan growth, deposit mobilisation, margins and stressed-asset trends after September 2026.