










Sampre Nutritions Q2 revenue up 33%, profit down 41%
Key highlights
- Sampre Nutritions reported Q2 FY27 revenue from operations of Rs 13.2943 crore, up 33% year on year.
- Sampre Nutritions’ Q2 FY27 profit after tax fell 41% year on year to Rs 52.70 lakh.
- Cost of materials consumed rose to Rs 5.8869 crore in Q2 FY27 from Rs 3.2573 crore a year earlier.
- Long-term borrowings fell to Rs 5.1312 crore at 30 September 2026 from Rs 12.7528 crore at 31 March 2026.
powered by IRIS
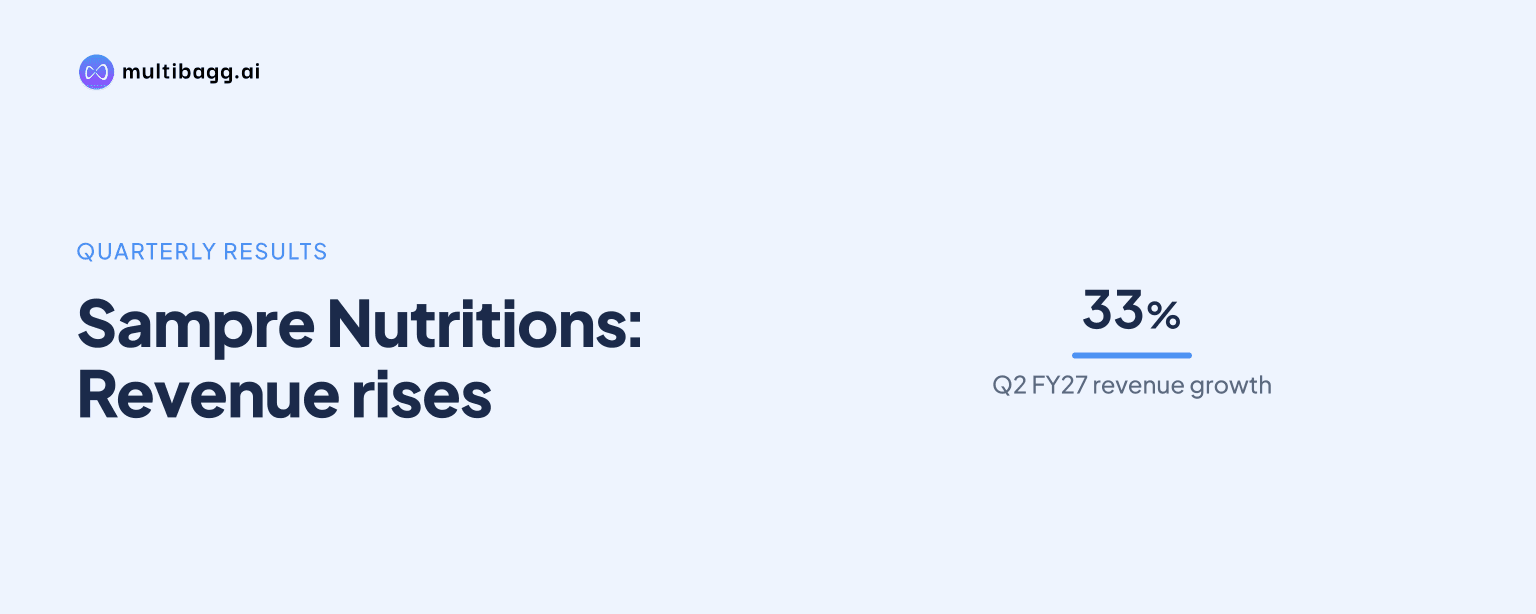
Sampre Nutritions reported standalone revenue from operations of Rs 13.2943 crore for the quarter ended 30 September 2026, up 33% from Rs 9.9974 crore a year earlier, while profit after tax fell 41% to Rs 52.70 lakh from Rs 89.47 lakh as materials and employee costs increased. The results were unaudited and subject to limited review.
Know Sampre Nutritions inside out
Results, valuation, peers and who's buying, in one view.
How did Sampre Nutritions perform in Q2 FY27?
Sampre Nutritions increased revenue from operations by Rs 3.2969 crore year on year in the quarter ended 30 September 2026, while total revenue rose to Rs 13.2943 crore from Rs 10.0028 crore in the corresponding quarter of FY26. Other income was Rs 49,000, compared with Rs 54,000 a year earlier, and the company reported no exceptional or extraordinary items in either period.
Sampre Nutritions reported profit before tax of Rs 63.82 lakh in Q2 FY27, down from Rs 1.0615 crore in Q2 FY26. Profit after tax was Rs 52.70 lakh, compared with Rs 89.47 lakh, while basic earnings per equity share fell to Rs 0.24 from Rs 0.41. Sequentially, revenue from operations was below Rs 14.8480 crore in the quarter ended 30 June 2026 and profit after tax was below Rs 70.21 lakh.
What caused Sampre Nutritions’ profit to fall despite higher sales?
Sampre Nutritions’ total expenses rose faster than revenue in Q2 FY27, increasing by Rs 3.7148 crore to Rs 12.6561 crore from Rs 8.9413 crore, or about 42% year on year. Revenue from operations increased about 33% over the same comparison, leaving profit before tax at Rs 63.82 lakh rather than Rs 1.0615 crore in Q2 FY26.
Cost of materials consumed rose to Rs 5.8869 crore from Rs 3.2573 crore, an increase of Rs 2.6296 crore. Employee benefits expense increased to Rs 3.6863 crore from Rs 2.6947 crore, while finance costs rose to Rs 45.83 lakh from Rs 28.34 lakh. These increases were partly offset by other expenses falling to Rs 1.9369 crore from Rs 2.1162 crore and depreciation declining to Rs 51.15 lakh from Rs 60.97 lakh.
The filing provides expense line items but does not give management’s narrative explanation for the increase in material consumption or employee benefits. The Q2 tax expense was Rs 11.12 lakh, versus Rs 16.68 lakh a year earlier, so the lower tax charge did not prevent profit after tax from declining to Rs 52.70 lakh.
How did Sampre Nutritions’ first-half results compare year on year?
Sampre Nutritions reported revenue from operations of Rs 28.1374 crore for the half year ended 30 September 2026, compared with Rs 20.8639 crore in the corresponding half year ended 30 September 2025. Profit after tax for the six-month period declined to Rs 1.2291 crore from Rs 1.6041 crore despite the Rs 7.2735 crore increase in operating revenue.
Cost of materials consumed for the half year rose to Rs 12.2451 crore from Rs 7.2027 crore, while employee benefits expense rose to Rs 8.9625 crore from Rs 5.8634 crore. Total expenses increased to Rs 26.7726 crore from Rs 19.1234 crore, and profit before tax fell to Rs 1.4370 crore from Rs 1.7709 crore.
The half-year results also show finance costs of Rs 71.52 lakh, against Rs 59.15 lakh in the prior-year half, while other expenses declined to Rs 3.8260 crore from Rs 4.4535 crore. The filing does not provide a business-segment or product-level revenue split, so it does not identify which operations drove the increase in revenue from operations.
Got a follow-up? Ask IRIS
What changed in Sampre Nutritions’ balance sheet and borrowings?
Sampre Nutritions’ total assets were Rs 125.0424 crore at 30 September 2026, compared with Rs 126.9787 crore at 31 March 2026. Property, plant and equipment declined to Rs 19.6239 crore from Rs 20.0984 crore, while inventories increased to Rs 7.9215 crore from Rs 7.5960 crore.
Trade and other receivables decreased to Rs 12.5325 crore at 30 September 2026 from Rs 13.2802 crore at 31 March 2026. Cash and cash equivalents were Rs 5.20 lakh at 30 September 2026, compared with Rs 6.25 lakh at the preceding financial year end, according to the assets and liabilities statement.
Long-term borrowings fell to Rs 5.1312 crore from Rs 12.7528 crore, and short-term borrowings declined to Rs 3.8431 crore from Rs 5.1573 crore. Equity share capital increased to Rs 48.3898 crore from Rs 47.5045 crore, while other equity increased to Rs 60.5138 crore from Rs 52.7331 crore over the same period.
What does Sampre Nutritions’ cash flow statement show?
Sampre Nutritions reported net cash generated from operating activities of Rs 3.9049 crore for the half year ended 30 September 2026. The cash-flow statement presents a comparison with Rs 94.10 lakh of net cash used in operating activities for the financial year ended 31 March 2026, rather than the corresponding prior-year half year.
Operating profit before working-capital changes was Rs 3.1030 crore for the six months, including profit before tax of Rs 1.4370 crore, depreciation of Rs 1.0230 crore and finance cost of Rs 71.52 lakh. Working-capital movements included a Rs 32.55 lakh increase in inventories, a Rs 74.70 lakh increase in other current non-financial assets and a Rs 1.7806 crore increase in other current financial liabilities.
Investing activities used Rs 1.1493 crore during the half year, including Rs 74.70 lakh in loans to a subsidiary and Rs 47.45 lakh in fixed assets including capital work in progress. Financing activities used Rs 2.7556 crore, with Rs 7.6216 crore of net long-term borrowing repayment, Rs 1.3142 crore of short-term borrowing reduction and Rs 6.8954 crore of equity proceeds.
How did Sampre Nutritions’ Q2 profitability compare with Q1 FY27?
Sampre Nutritions’ Q2 FY27 total revenue of Rs 13.2943 crore was below Rs 14.9153 crore in Q1 FY27. Total expenses declined to Rs 12.6561 crore from Rs 14.1165 crore over the same sequential comparison, but profit before tax also fell to Rs 63.82 lakh from Rs 79.88 lakh.
Profit after tax decreased by Rs 17.51 lakh from Rs 70.21 lakh in Q1 FY27 to Rs 52.70 lakh in Q2 FY27. Basic earnings per equity share was Rs 0.24 in Q2, compared with Rs 0.33 in Q1, while the diluted figure was Rs 0.24 in Q2 and Rs 0.50 in Q1 as reported in the filing.
Materials consumed declined sequentially to Rs 5.8869 crore from Rs 6.3595 crore, and employee benefits expense declined to Rs 3.6863 crore from Rs 5.0993 crore. Other income fell to Rs 49,000 from Rs 6.73 lakh, while finance costs increased to Rs 45.83 lakh from Rs 25.69 lakh, based on the unaudited quarterly statement.
Conclusion
Sampre Nutritions recorded higher Q2 FY27 operating revenue, but the gain did not translate into higher earnings because total expenses rose 42% year on year against a 33% increase in revenue. Materials consumed increased by Rs 2.6296 crore and employee benefits expense by Rs 99.16 lakh, contributing to a 41% decline in profit after tax to Rs 52.70 lakh.
What to watch next is whether the disclosed rise in materials and employee costs persists relative to revenue, after first-half material consumption reached Rs 12.2451 crore and employee benefits expense reached Rs 8.9625 crore. The 6 November 2026 filing provides no revenue or earnings target and no management explanation for those cost movements.