










Sanstar operating cash flow turns negative in H1 FY27
Key highlights
- Sanstar reported Rs 8.10 crore of net cash used in operating activities in H1 FY27, versus Rs 45.00 crore generated in H1 FY26.
- Inventory increased by Rs 20.50 crore in H1 FY27, the largest disclosed working-capital cash outflow.
- Sanstar recorded Rs 197.69 crore of fresh share-issue proceeds in H1 FY27 financing cash flows.
- Other bank balances were Rs 271.69 crore at September 30, 2026, compared with Rs 6.62 crore at March 31, 2026.
powered by IRIS
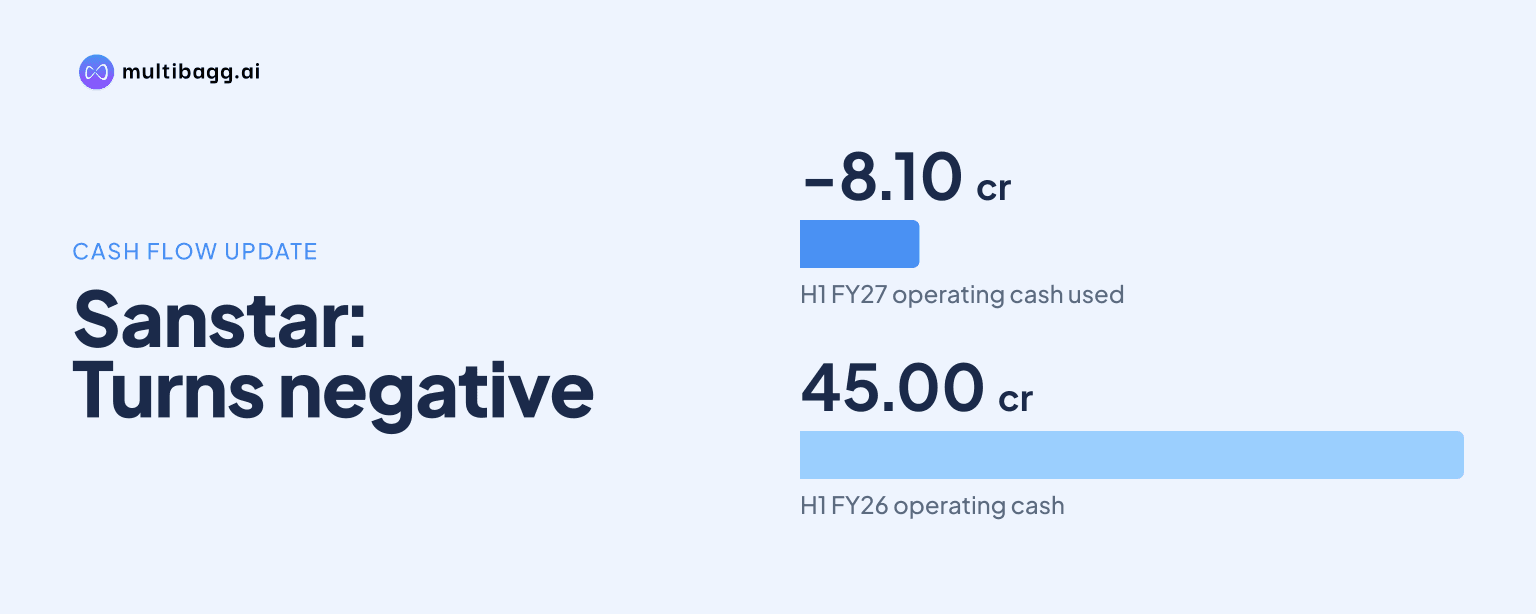
Sanstar Limited recorded net cash used in operating activities of Rs 8.10 crore for the half year ended September 30, 2026, against Rs 45.00 crore generated a year earlier. Sanstar’s Rs 20.50 crore inventory build, lower trade payables and other working-capital movements outweighed Rs 23.37 crore of operating profit before working-capital changes.
Know Sanstar inside out
Results, valuation, peers and who's buying, in one view.
Why did Sanstar’s operating cash flow turn negative?
Sanstar’s operating cash flow turned negative because its working-capital cash uses exceeded cash generated before those changes in the half year ended September 30, 2026. Operating profit before working-capital changes was Rs 23.37 crore, after starting with profit before tax of Rs 20.54 crore and adjusting for Rs 10.66 crore of depreciation and amortisation, Rs 0.94 crore of finance costs and Rs 8.06 crore of interest income.
Inventory was the largest identified use of operating cash, rising by Rs 20.50 crore during H1 FY27. Trade receivables used Rs 1.62 crore, trade payables declined by Rs 6.39 crore, other current assets used Rs 0.84 crore and other financial liabilities declined by Rs 1.36 crore. These movements were partly offset by a Rs 2.20 crore increase in provisions and a Rs 1.15 crore decrease in other financial assets.
Cash used in operations was Rs 5.21 crore before taxes, and net income taxes paid added a further Rs 2.89 crore outflow. This produced the Rs 8.10 crore net operating cash outflow, compared with Rs 45.00 crore generated in the half year ended September 30, 2025. The reported cash-flow outcome therefore reversed even though Sanstar reported Rs 20.54 crore of profit before tax in H1 FY27.
How did Sanstar’s cash flows compare with last year?
Sanstar moved from operating cash generation to an operating cash outflow in H1 FY27, while its investing cash outflow narrowed and financing cash flow turned substantially positive. The following comparison uses the unaudited standalone cash-flow statement for the two half-year periods.
The Rs 53.10 crore change in operating cash flow reflected sharply different working-capital movements, particularly inventory. In the prior-year half, inventories released Rs 16.74 crore of cash and trade receivables released Rs 13.40 crore, whereas both inventories and receivables used cash in H1 FY27. The company prepares the cash-flow statement under the indirect method set out in Indian Accounting Standard 7, or Ind AS 7.
Cash and cash equivalents ended H1 FY27 at Rs 19.12 crore, compared with Rs 37.01 crore at the end of the prior-year half. The September 30, 2026 closing balance included Rs 18.25 crore in deposits with original maturity of less than three months, Rs 0.78 crore in current accounts and Rs 0.08 crore of cash on hand.
How much did Sanstar invest in assets and deposits?
Sanstar spent Rs 68.24 crore on property, plant and equipment in H1 FY27, including capital work-in-progress, capital advances and payables. That was lower than the Rs 87.99 crore spent in the half year ended September 30, 2025, but remained the largest individual investing outflow after the company’s Rs 161.60 crore placement in other bank deposits.
The company recorded Rs 16.39 crore of net proceeds from the purchase or sale of other investments and received Rs 7.54 crore of interest income during H1 FY27. It also recorded Rs 2.04 crore from the purchase or redemption of non-current fixed deposits with banks. Together, these items resulted in net cash used in investing activities of Rs 104.07 crore, compared with Rs 122.44 crore a year earlier.
At September 30, 2026, property, plant and equipment stood at Rs 440.87 crore, up from Rs 424.43 crore at March 31, 2026, while capital work-in-progress rose to Rs 27.34 crore from Rs 11.01 crore. Other bank balances increased to Rs 271.69 crore from Rs 6.62 crore, whereas current investments declined to Rs 11.08 crore from Rs 94.82 crore over the same period.
Got a follow-up? Ask IRIS
How did Sanstar use the fresh equity issue proceeds?
Sanstar recorded Rs 197.69 crore of proceeds from a fresh share issue within H1 FY27 financing cash flows. Separately, it said it completed a preferential issue on June 24, 2026, allotting 1,80,24,157 equity shares of face value Rs 2 each to non-promoter Corn Products Development Inc. at an issue price of Rs 110 per share, aggregating to Rs 198.27 crore including securities premium.
The disclosed objects were Rs 81.20 crore for working-capital requirements and Rs 49.07 crore for general corporate purposes, totalling Rs 130.27 crore. By September 30, 2026, Sanstar had utilised Rs 31.16 crore for working capital and Rs 47.61 crore for general corporate purposes. The corresponding unutilised balances were Rs 50.04 crore and Rs 1.45 crore.
Sanstar said the unutilised proceeds were temporarily invested in fixed deposits with a scheduled bank or held in a separate account at September 30, 2026. Other bank balances of Rs 271.69 crore at that date were higher than the Rs 6.62 crore balance at March 31, 2026, but the filing does not attribute the full increase in that balance exclusively to preferential-issue proceeds.
What changed in Sanstar’s financing and balance sheet?
Sanstar generated Rs 207.68 crore of net financing cash flow in H1 FY27, compared with Rs 5.78 crore used in H1 FY26. In addition to the Rs 197.69 crore fresh-issue proceeds, short-term borrowings generated Rs 13.32 crore; this was partly offset by Rs 2.39 crore of long-term borrowing repayments and Rs 0.94 crore of finance costs paid.
Total equity rose to Rs 906.70 crore at September 30, 2026 from Rs 693.93 crore at March 31, 2026. Equity share capital increased to Rs 40.05 crore from Rs 36.45 crore, while other equity rose to Rs 866.65 crore from Rs 657.48 crore. Non-current borrowings were Rs 7.62 crore, down from Rs 9.96 crore at the March 2026 year-end.
Inventories on the September 30 balance sheet were Rs 62.61 crore, compared with Rs 42.12 crore at March 31, 2026. This Rs 20.49 crore balance-sheet movement broadly corresponds with the Rs 20.50 crore inventory cash outflow in the H1 FY27 cash-flow statement. Sanstar operates in one segment, manufacturing and trading of commodities, and therefore disclosed no separate segment-level inventory or cash-flow data.
Conclusion
Sanstar’s H1 FY27 cash profile differed materially from the prior-year half: an Rs 8.10 crore operating cash outflow replaced Rs 45.00 crore of operating cash generation as inventories absorbed Rs 20.50 crore and several other working-capital lines used cash. At the same time, Rs 197.69 crore of fresh-issue proceeds entered financing cash flows, while Rs 104.07 crore was used in investing activities.
The next disclosed item to watch is the use of Rs 50.04 crore of working-capital proceeds and Rs 1.45 crore of general-corporate-purpose proceeds that remained unutilised at September 30, 2026. Sanstar said these funds were temporarily placed in fixed deposits or held in a separate account, while property, plant and equipment plus capital work-in-progress reached Rs 468.21 crore at the reporting date.