










SAR Televenture Ltd. H1 FY27 EBITDA margin reaches 24.46%
Key highlights
- SAR reported a 24.46% EBITDA margin in H1 FY27, compared with 19.10% in FY26.
- H1 FY27 depreciation was Rs 30.88 crore, reducing EBITDA of Rs 62.04 crore to EBIT of Rs 31.16 crore.
- SAR reported H1 FY27 PAT of Rs 25.39 crore and a PAT margin of 10.01%.
- H1 FY27 total revenue was Rs 253.65 crore, including Rs 250.92 crore of revenue from operations.
powered by IRIS
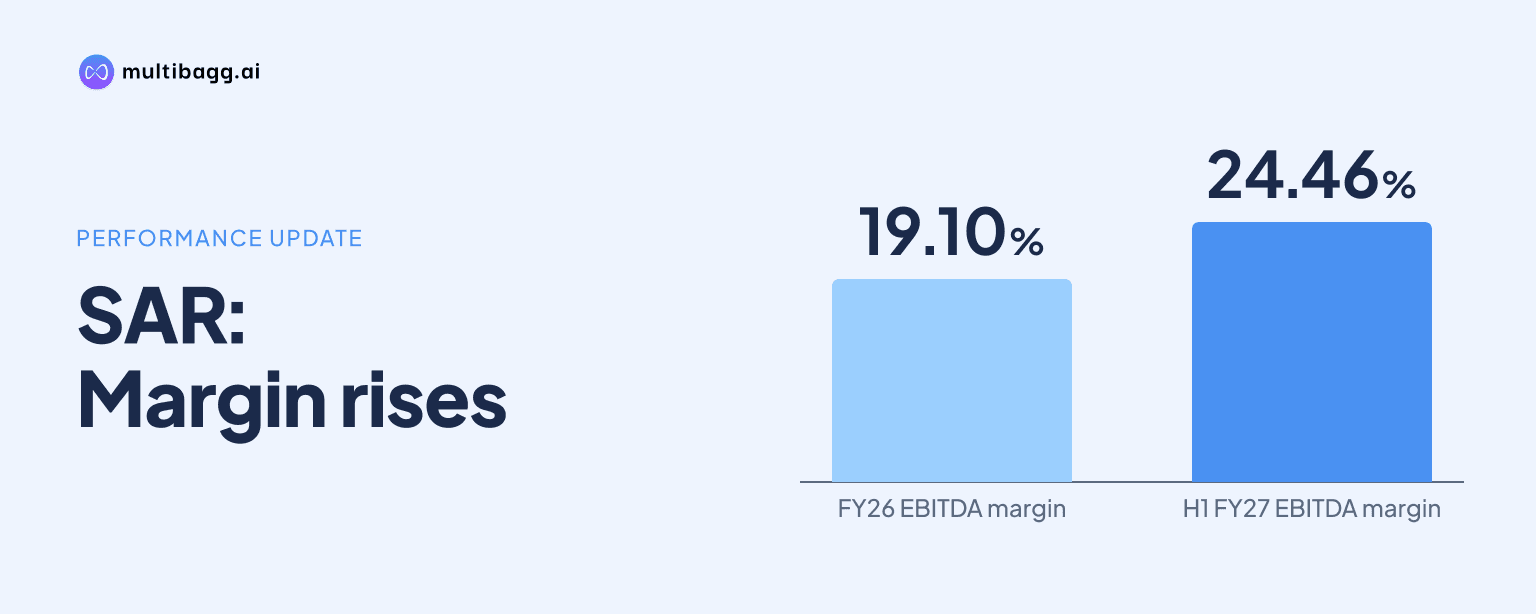
In H1 FY27, SAR Televenture Ltd. recorded a 24.46% EBITDA margin, up from 19.10% in FY26, but its PAT margin fell to 10.01% as Rs 30.88 crore of depreciation reduced EBITDA of Rs 62.04 crore to EBIT of Rs 31.16 crore.
Know Sar Televenture inside out
Results, valuation, peers and who's buying, in one view.
How did SAR's operating profitability change in H1 FY27?
SAR's operating profitability improved in H1 FY27, with earnings before interest, tax, depreciation and amortisation (EBITDA) margin reaching 24.46%, compared with 19.10% in FY26 and 17.62% in FY25. EBITDA was Rs 62.04 crore in H1 FY27, against Rs 99.75 crore in full-year FY26 and Rs 61.65 crore in FY25.
The margin increased by 5.36 percentage points from FY26 and by 6.84 percentage points from FY25. H1 FY27 total revenue was Rs 253.65 crore, comprising Rs 250.92 crore of revenue from operations and Rs 2.73 crore of other income, while total expenses were Rs 191.61 crore before EBITDA.
The presentation compares a six-month H1 FY27 period with full-year FY25 and FY26 figures. It therefore establishes that the H1 FY27 EBITDA margin was higher than the two earlier annual margins, but it does not provide H1 FY26 revenue, EBITDA or expenses for a like-for-like first-half comparison.
Why did SAR's PAT margin fall to 10.01%?
SAR's PAT margin fell to 10.01% in H1 FY27 because depreciation of Rs 30.88 crore reduced EBITDA of Rs 62.04 crore to earnings before interest and tax (EBIT) of Rs 31.16 crore. Profit after tax (PAT) was Rs 25.39 crore, compared with Rs 72.49 crore in FY26 and Rs 46.88 crore in FY25.
Depreciation was Rs 30.88 crore in H1 FY27, exceeding the Rs 18.37 crore reported for full-year FY26 and Rs 9.91 crore for FY25. The presentation does not disclose H1 FY26 depreciation, the reason for the H1 FY27 charge, or a depreciation target for FY27; it therefore does not support a matched half-year comparison or a stated explanation for the increase.
After depreciation, financial costs of Rs 0.69 crore reduced EBIT of Rs 31.16 crore to profit before tax of Rs 30.47 crore. Total tax was Rs 5.07 crore, comprising Rs 4.96 crore of current tax and Rs 0.11 crore of deferred tax, resulting in PAT of Rs 25.39 crore.
The difference between EBITDA margin and PAT margin was 14.45 percentage points in H1 FY27, versus 5.22 percentage points in FY26. This wider separation is reflected in the reported post-EBITDA charges, led by depreciation, rather than in the EBITDA margin itself.
Got a follow-up? Ask IRIS
Which H1 FY27 costs shaped SAR's EBITDA margin?
SAR's largest H1 FY27 operating expense was Rs 163.66 crore of purchases of stock-in-trade, followed by Rs 18.09 crore of other expenses and Rs 10.36 crore of employee benefit expense. Revenue-sharing expenses were Rs 2.90 crore, while the change in inventories was negative Rs 3.39 crore.
These line items, together with the other reported operating costs, resulted in total expenses of Rs 191.61 crore against total revenue of Rs 253.65 crore. The negative inventory-change figure reduced expenses in the income statement, whereas stock purchases, employee benefits, revenue sharing and other expenses increased them.
The table shows that purchases of stock-in-trade remained the dominant expense line in both periods, at Rs 163.66 crore in H1 FY27 and Rs 371.22 crore in FY26. However, FY26 is a full-year period, so the figures show reported cost composition rather than a like-for-like change in cost levels.
SAR's H1 FY27 employee benefit expense of Rs 10.36 crore and other expenses of Rs 18.09 crore totalled Rs 28.45 crore. Depreciation of Rs 30.88 crore was higher than those two operating-cost categories combined and was recorded after EBITDA, which is why it affected EBIT and PAT rather than the reported EBITDA margin.
What balance-sheet movements accompanied H1 FY27?
SAR reported total liabilities of Rs 1,256.31 crore at H1 FY27, compared with Rs 1,107.24 crore at FY26. Current liabilities rose to Rs 223.37 crore from Rs 120.53 crore, while non-current liabilities increased to Rs 18.33 crore from Rs 10.31 crore.
Short-term borrowings were Rs 34.75 crore at H1 FY27, compared with Rs 0.30 crore at FY26, and other current liabilities increased to Rs 179.55 crore from Rs 31.66 crore. Trade payables moved in the other direction, falling to Rs 0.91 crore from Rs 84.54 crore over the same reported periods.
Shareholders' funds rose to Rs 1,014.61 crore at H1 FY27 from Rs 976.39 crore at FY26, including reserves and surplus of Rs 982.60 crore. Long-term borrowings were Rs 8.44 crore, up from Rs 1.14 crore, but the presentation does not explicitly link these balance-sheet movements to the Rs 30.88 crore depreciation charge or the H1 FY27 margin outcome.
Conclusion
SAR's H1 FY27 figures show a higher operating margin alongside a lower net margin. EBITDA margin rose to 24.46% from 19.10% in FY26, but depreciation of Rs 30.88 crore, financial costs of Rs 0.69 crore and total tax of Rs 5.07 crore resulted in a 10.01% PAT margin, below FY26's 13.88%.
What to watch next is whether SAR provides a matched H1 FY26 comparison, further detail on the depreciation charge, or a full-year FY27 target. The presentation supplies annual FY25 and FY26 data and H1 FY27 results, but does not disclose a FY27 revenue, EBITDA, depreciation or PAT target.