










Shyam Metalics Q2 PAT nearly doubles as depreciation halves
Key highlights
- Shyam Metalics’ Q2 FY27 PAT rose 96.2% year on year to Rs 511.0 crore.
- Q2 FY27 revenue increased 33.4% to Rs 5,960.2 crore and operating EBITDA rose 52.6% to Rs 823.0 crore.
- Depreciation fell to Rs 110.0 crore in Q2 FY27 from Rs 211.2 crore a year earlier after the company adopted straight-line depreciation.
- Net debt stood at Rs 192 crore at 30 September 2026, compared with net cash of Rs 378 crore at 31 March 2026.
powered by IRIS
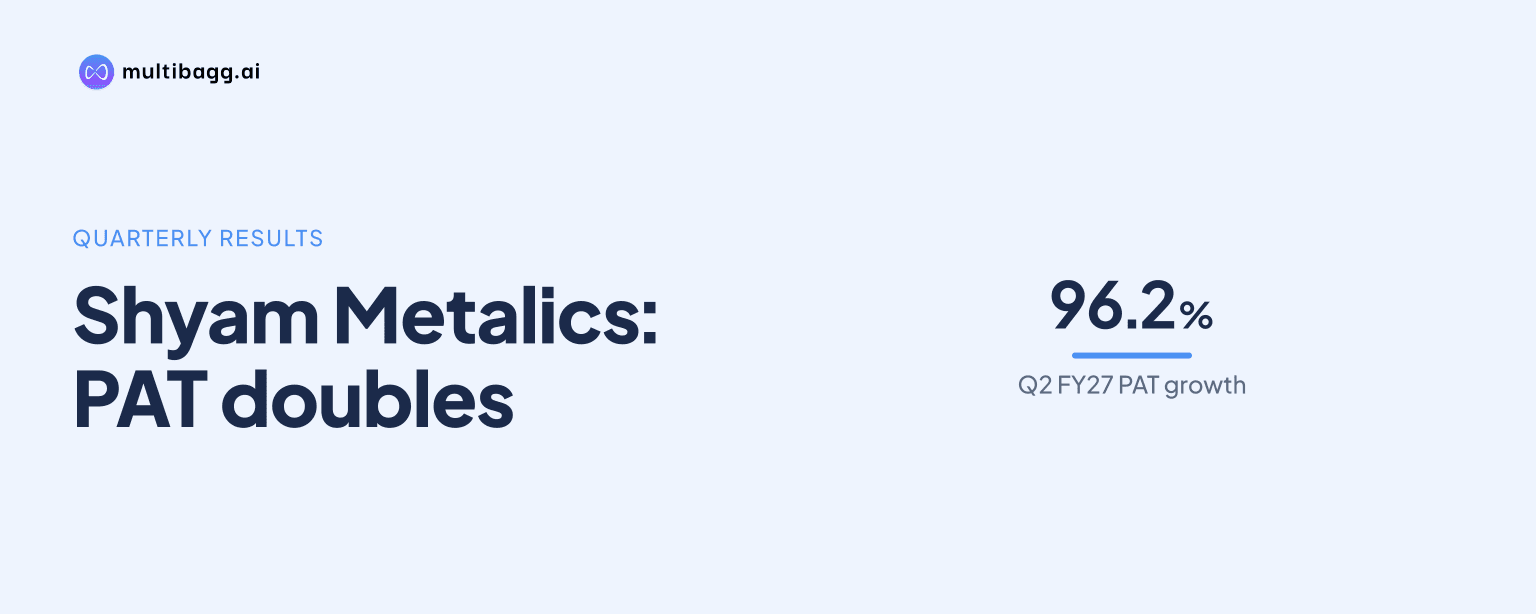
Shyam Metalics reported Q2 FY27 profit after tax (PAT) of Rs 511.0 crore, up 96.2% year on year, alongside revenue growth of 33.4% to Rs 5,960.2 crore and a 52.6% increase in operating earnings before interest, tax, depreciation and amortisation (EBITDA). The quarter also marked its shift to straight-line depreciation, with depreciation at Rs 110.0 crore.
Know Shyam Metalics & Energy inside out
Results, valuation, peers and who's buying, in one view.
Why did Shyam Metalics’ Q2 FY27 PAT rise 96%?
Shyam Metalics’ PAT rose because revenue, gross profit and operating EBITDA increased, while reported depreciation declined sharply in the quarter. PAT reached Rs 511.0 crore in Q2 FY27, against Rs 260.5 crore in Q2 FY26 and Rs 350.7 crore in Q1 FY27. PAT margin increased to 8.6% from 5.8% a year earlier and 6.4% in the preceding quarter.
Revenue from operations rose to Rs 5,960.2 crore from Rs 4,467.4 crore in Q2 FY26, while operating EBITDA increased to Rs 823.0 crore from Rs 539.4 crore. Total EBITDA, including other income, rose 40.9% to Rs 857.2 crore, although other income declined to Rs 34.2 crore from Rs 69.1 crore. Finance cost increased to Rs 88.7 crore from Rs 50.3 crore.
How did the depreciation-method change affect Q2 FY27?
Shyam Metalics adopted the straight-line method of depreciation effective in Q2 FY27, replacing the written-down-value method. Under the earlier method, depreciation was higher in the initial years and declined over time; the new method applies uniform annual depreciation over an asset’s useful life. Management described the change as a widely accepted industry practice to depict the real picture and provide a stable return profile.
Depreciation was Rs 110.0 crore in Q2 FY27, compared with Rs 211.2 crore in Q2 FY26 and Rs 264.9 crore in Q1 FY27. Earnings before interest and tax rose to Rs 747.1 crore from Rs 397.4 crore a year earlier, while profit before tax increased to Rs 658.4 crore from Rs 347.1 crore. The change coincided with higher operating EBITDA, rather than replacing the operating improvement.
For H1 FY27, depreciation was Rs 374.9 crore, compared with Rs 415.7 crore in H1 FY26. The smaller six-month reduction is consistent with the policy becoming effective during Q2 rather than at the beginning of H1. H1 FY27 PAT increased 56.4% to Rs 861.7 crore, while operating EBITDA rose 41.9% to Rs 1,588.3 crore.
What operating trends supported Shyam Metalics’ earnings growth?
Shyam Metalics increased gross profit faster than revenue in Q2 FY27, lifting gross profit margin to 29.0% from 26.9% in Q2 FY26. Gross profit rose 44.2% to Rs 1,730.2 crore as total raw-material cost increased to Rs 4,230.0 crore from Rs 3,267.2 crore. Operating EBITDA margin was 13.8%, above 12.1% a year earlier but below 14.0% in Q1 FY27.
Sales volumes grew most rapidly in metallics and carbon steel flat products. Metallics, comprising iron pellets, sponge iron and pig iron, rose 39.2% year on year to 943,020 tonnes in Q2 FY27. Carbon steel flat-product volume rose 109.7% to 81,493 tonnes, while stainless-steel volume increased 20.7% to 29,847 tonnes.
Realisation movement differed across products in Q2 FY27. Speciality-alloy realisation rose 18.4% year on year to Rs 1,12,792 per tonne, stainless-steel realisation increased 35.2% to Rs 1,77,156 per tonne, and aluminium-foil realisation gained 27.7% to Rs 4,96,215 per tonne. Metallics realisation fell 9.3% sequentially to Rs 20,325 per tonne, while carbon steel long-product realisation declined 4.5% from Q1 FY27 to Rs 43,723 per tonne.
Got a follow-up? Ask IRIS
What balance-sheet and cash-flow changes accompanied the quarter?
Shyam Metalics’ total assets rose to Rs 23,194.9 crore at 30 September 2026 from Rs 20,060.8 crore at 31 March 2026. Property, plant and equipment increased to Rs 8,880.5 crore from Rs 7,968.7 crore, while capital work-in-progress rose to Rs 3,019.9 crore from Rs 2,791.9 crore. Total equity increased to Rs 12,348.6 crore from Rs 11,522.8 crore.
Gross debt was Rs 1,333 crore at September 2026, compared with Rs 957 crore at March 2026, and net debt was Rs 192 crore against net cash of Rs 378 crore at March 2026. Shyam Metalics defines net debt as gross debt less liquid long- and short-term investments and cash and cash equivalents. Gross debt to equity increased to 0.11 from 0.08, while net debt to EBITDA moved to 0.12 from negative 0.16.
Cash flow from operations was Rs 1,544 crore in H1 FY27 and capital expenditure was Rs 1,291 crore, equal to 84% of operating cash flow. Cash and cash equivalents were Rs 1,115 crore in H1 FY27, compared with Rs 1,238 crore in FY26. Working capital was negative 16 days at September 2026, comprising 119 inventory days, 18 debtor days and 153 creditor days.
How does Shyam Metalics’ FY31 plan frame the next phase?
Shyam Metalics projects FY27P volume of 61.62 lakh tonnes, compared with 49.46 lakh tonnes in FY26. H1 FY27 sales volume was 29.32 lakh tonnes, 20% above 24.39 lakh tonnes in H1 FY26. Management’s Vision 2031 framework targets revenue of more than Rs 42,500 crore and EBITDA of more than Rs 6,600 crore by FY31, compared with Rs 18,552 crore and Rs 2,333 crore, respectively, in FY26.
Management’s plan includes expanding stainless steel, aluminium foil, carbon steel coils and sheets, special bar quality steel and railway wagons. Its revised FY31 guidance specifies return on capital employed of 24% and return on equity of 16%. The framework also projects gross debt of about Rs 4,226 crore, net cash of about Rs 912 crore and cash accrual of about Rs 5,198 crore in FY31.
Conclusion
Shyam Metalics’ Q2 FY27 result combined higher sales, volume expansion and improved gross profitability with substantially lower depreciation following the accounting-method change. Revenue increased 33.4%, operating EBITDA increased 52.6% and PAT increased 96.2%, so the quarterly profit movement reflects both operating performance and the new depreciation profile.
The next measure to watch is progress toward management’s FY27P volume projection of 61.62 lakh tonnes and its FY31 revenue target of more than Rs 42,500 crore. Capital expenditure was Rs 1,291 crore in H1 FY27, and the pace at which it supports the planned product mix and capacity expansion remains relevant to those targets.