










SMS Pharma high-value mix reaches 49% in H1FY27 portfolio
Key highlights
- SMS Pharma reported a 49% high-value product share in H1FY27, compared with 47% in FY26.
- SMS Pharma lists FY27 gross margin excluding manufacturing expenses at 44%.
- SMS Pharma has 120 KL of Hyderabad capacity and 3,000 KL of Vizag capacity.
- SMS Pharma added 20 products since FY22 and filed 12 regulatory submissions in FY26.
powered by IRIS
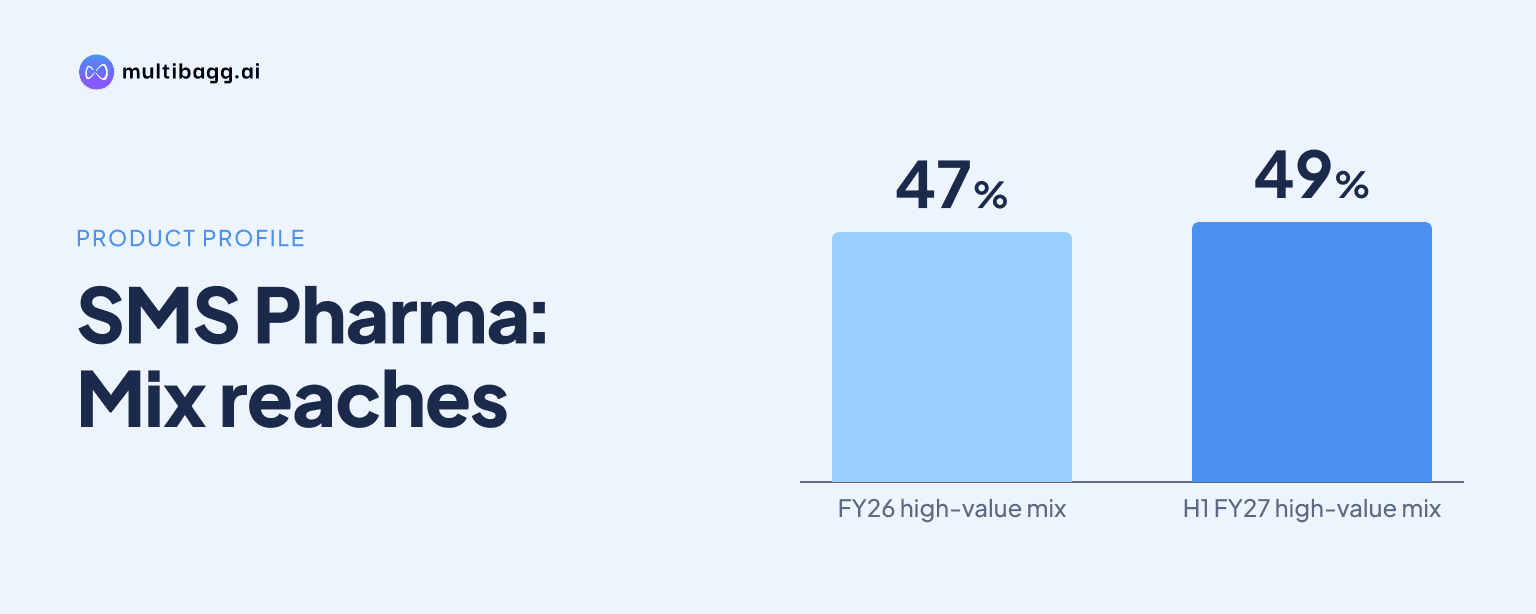
SMS Pharmaceuticals Limited reported that high-value products represented 49% of its portfolio in the first half of financial year 2027 (H1FY27), up from 47% in FY26, while its presentation lists a 44% FY27 gross margin excluding manufacturing expenses. SMS Pharma attributes margin protection to product mix, manufacturing scale, regulated-market operations and process optimisation.
Know SMS Pharmaceuticals inside out
Results, valuation, peers and who's buying, in one view.
How has SMS Pharma’s high-value product mix changed?
SMS Pharma’s high-value product share reached 49% in H1FY27, 2 percentage points above FY26’s 47% and 19 percentage points above FY21’s 30%. The presentation describes this as a stable high-value portfolio, although the reported H1FY27 share remains one percentage point below half of the portfolio.
The increase was not continuous across the seven disclosed periods. The share rose from 40% in FY22 to 44% in FY23, fell to 42% in FY24, and then increased to 44% in FY25 and 47% in FY26. SMS Pharma says high-value products support better realisation per metric tonne (MT), but it does not disclose product-level pricing or the revenue contribution of individual high-value molecules.
SMS Pharma’s FY26 therapeutic-area revenue was led by anti-retroviral products at 28%, followed by anti-inflammatory products at 20%, anti-diabetic products at 15% and anti-migraine products at 11%. Anti-erectile dysfunction and anti-epileptic products each contributed 6%, anti-ulcer and anti-anginal products each contributed 5%, and other therapeutic areas accounted for 4%.
What does SMS Pharma’s gross-margin record show?
SMS Pharma lists gross margin excluding manufacturing expenses at 44% for FY27, equal to the FY25 and FY26 H1 figures and 8 percentage points above FY17’s 36%. The presentation labels the measure as gross margin excluding manufacturing expenses, meaning it is not a fully specified gross-margin measure incorporating every manufacturing cost.
The historical record shows both expansion and movement between periods. Gross margin rose from 36% in FY17 to 47% in FY22, then declined by 11 percentage points to 36% in FY23 before recovering to 40% in FY24 and 44% in FY25. SMS Pharma presents the FY27 44% level as sustained margin expansion across competitive generics cycles.
SMS Pharma identifies four mechanisms behind its margin model: high-value product mix, scalable manufacturing, a regulated-market foothold, and research and development (R&D). Management says scale can create operating leverage, while regulated-market operations can support pricing power and durability. The presentation does not quantify the margin contribution from any one of these mechanisms.
Got a follow-up? Ask IRIS
How do SMS Pharma’s facilities support its margin strategy?
SMS Pharma operates 120 kilolitres (KL) of capacity in Hyderabad for niche small-volume molecules and 3,000 KL in Vizag for niche large-volume molecules. The two sites therefore serve materially different production scales, with Vizag’s listed capacity 25 times Hyderabad’s capacity.
The Hyderabad site covers 48,158 square metres and lists approvals from the United States Food and Drug Administration (USFDA), European Union Good Manufacturing Practice (EU GMP), Korea Food and Drug Administration, Central Drugs Standard Control Organisation and Pharmaceuticals and Medical Devices Agency. It has been approved by the USFDA six times, while Vizag, covering 345,007 square metres, lists four USFDA approvals alongside approvals from the Korean, Indian and Japanese regulators.
SMS Pharma also cites rapid scale-up of active pharmaceutical ingredients (APIs), first-to-market capability in selected therapeutic areas and operating leverage as manufacturing advantages. Its anti-inflammatory sales chart states a 138% compound annual growth rate (CAGR) from FY21 to FY26, but does not disclose annual sales volumes in MT. The disclosed CAGR therefore indicates category growth without allowing calculation of absolute anti-inflammatory sales.
What R&D and cash-flow evidence supports SMS Pharma’s model?
SMS Pharma says it has added 20 new products since FY22, filed 12 regulatory submissions in FY26 and developed more than 35 process patents. The company presents new product development and process optimisation as responses to price erosion, but it does not provide revenue, regulatory approval status or margin contribution for the 20 added products.
The R&D and commercialisation platform includes more than 200 scientists and more than 130 drug master files (DMFs) filed to date. A DMF is a regulatory dossier containing confidential information on drug substances, processes or facilities. SMS Pharma also cites its joint venture with Spanish pharmaceutical company Chemo Iberica S.A., without disclosing financial terms, production volumes or revenue attributable to that arrangement.
SMS Pharma reports a 10-year average operating cash flow (OCF) conversion ratio of 72%, compared with 62%, 66% and 68% for three unnamed peers and 82% for another unnamed peer. It defines the ratio as cash flow from operating activities divided by earnings before interest, tax, depreciation and amortisation (EBITDA). The presentation does not identify the peer companies or specify the years used in each 10-year average.
SMS Pharma’s FY26 customer mix gives further context for the model: large pharmaceutical customers represented 59% of revenue and mid-to-small pharmaceutical customers 41%. Europe contributed 22% of revenue, North America 26%, India 15%, Asia excluding India 6%, and export-oriented unit, special economic zone and deemed-export sales 31%; the largest customer accounted for 28%.
Conclusion
SMS Pharma’s disclosed strategy combines a high-value product share that rose from 30% in FY21 to 49% in H1FY27 with a presented FY27 gross margin of 44% excluding manufacturing expenses. Its manufacturing footprint spans 120 KL for smaller-volume molecules in Hyderabad and 3,000 KL for larger-volume molecules in Vizag, while its R&D programme includes 20 products added since FY22 and more than 35 process patents.
The next point to watch is execution of SMS Pharma’s stated plan for revenue growth with margin expansion. The presentation identifies commercialisation of new products, progress on 12 FY26 regulatory submissions, and deployment of more than 130 DMFs as relevant operating markers, but it provides no quantified future gross-margin target or deadline.