










Sodhani Capital Ltd. H1 FY27 PAT rose 27.8% on treasury gains
Key highlights
- H1 FY27 revenue from operations rose 14.7% year on year to Rs 2.51 crore.
- H1 FY27 PAT rose 27.8% year on year to Rs 1.60 crore.
- Other income was Rs 70.5 lakh in H1 FY27, including Rs 48.4 lakh of treasury gains.
- AUM reached Rs 566 crore on 30 September 2026, up 18.0% from 31 March 2026.
powered by IRIS
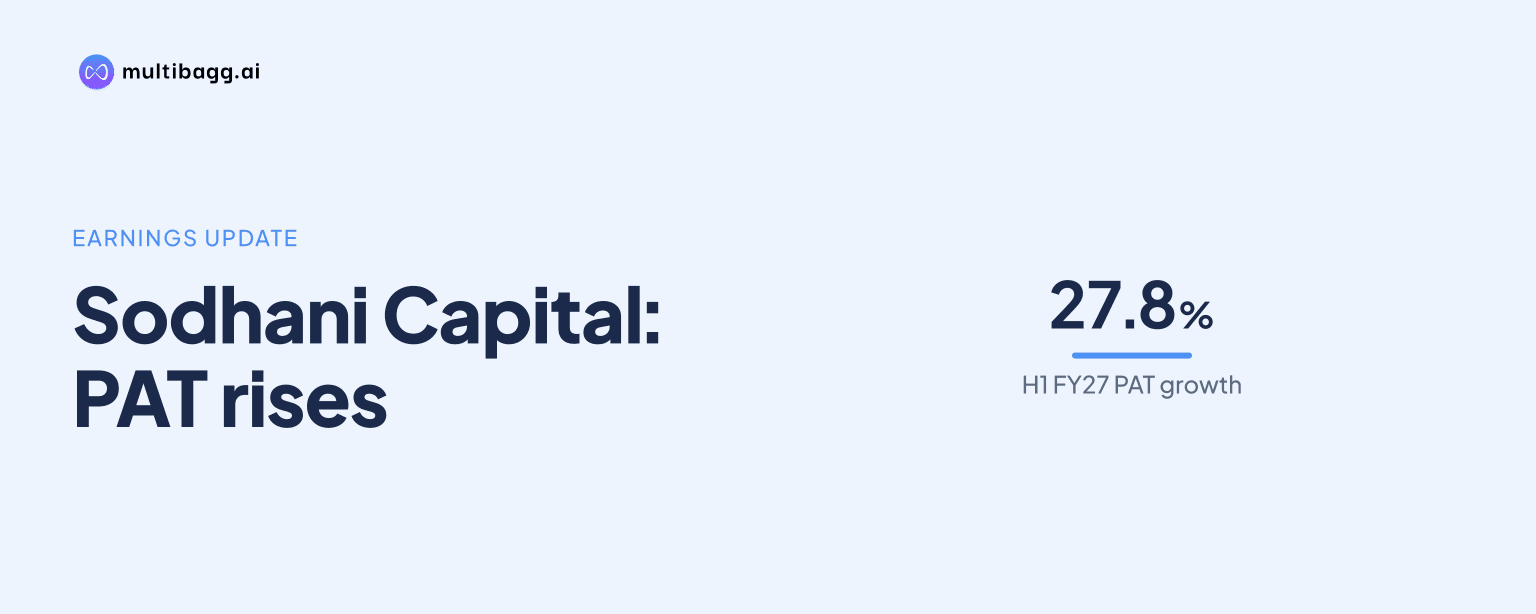
Sodhani Capital’s profit after tax, or PAT, rose 27.8% year on year to Rs 1.60 crore in H1 FY27, but Rs 70.5 lakh of other income, including Rs 48.4 lakh of treasury gains, helped lift earnings for the half-year ended 30 September 2026. Revenue from operations increased 14.7% to Rs 2.51 crore.
Know Sodhani Capital inside out
Results, valuation, peers and who's buying, in one view.
Why did Sodhani Capital’s H1 FY27 profit grow faster than revenue?
Sodhani Capital’s PAT grew faster than operating revenue because other income rose substantially in H1 FY27. Revenue from operations increased by Rs 32.1 lakh, from Rs 2.19 crore in H1 FY26 to Rs 2.51 crore, while PAT increased by Rs 34.7 lakh from Rs 1.25 crore to Rs 1.60 crore. The resulting 27.8% PAT growth was above the 14.7% increase in revenue from operations.
Other income was Rs 70.5 lakh in H1 FY27, compared with Rs 5.7 lakh in H1 FY26 and Rs 18.5 lakh in H2 FY26. Management identified Rs 48.4 lakh of the H1 FY27 amount as treasury gains. Total income, combining operating revenue and other income, therefore rose 43.2% year on year to Rs 3.21 crore, exceeding the growth rate of the operating-revenue line.
Profit before tax increased 39.0% to Rs 2.26 crore, while tax rose 75.6% to Rs 66.8 lakh. PAT margin reached 63.7% in H1 FY27, compared with 57.1% in H1 FY26 and 46.5% in H2 FY26. The presentation does not provide a breakdown of the Rs 22.1 lakh of other income that was not identified as treasury gains.
How did Sodhani Capital’s core operating performance change?
Sodhani Capital’s earnings before interest, tax, depreciation and amortisation, or EBITDA, rose 10.6% year on year to Rs 1.75 crore in H1 FY27, excluding other income. EBITDA was Rs 1.59 crore in H1 FY26 and Rs 1.51 crore in H2 FY26, making the H1 FY27 figure 16.4% higher than the preceding half-year. The presentation defines EBITDA as excluding other income.
EBITDA margin was 69.9% in H1 FY27, down 2.6 percentage points from 72.5% in H1 FY26, but up 6.1 percentage points from 63.8% in H2 FY26. Employee cost increased 55.7% year on year to Rs 46.8 lakh, while other expenses declined 4.8% to Rs 28.6 lakh. Operating expenses consequently rose 25.5% to Rs 75.3 lakh, faster than revenue from operations.
The period comparison shows that revenue rose both year on year and half on half, while margins followed different directions on those measures. H1 FY27 revenue was 6.1% above H2 FY26, and the EBITDA margin improved from 63.8%, but the margin remained below H1 FY26 because the year-on-year increase in employee cost exceeded operating-revenue growth.
How material was other income to Sodhani Capital’s H1 FY27 earnings?
Other income was material to Sodhani Capital’s reported H1 FY27 earnings because the Rs 70.5 lakh amount was recorded alongside PAT of Rs 1.60 crore. Treasury gains of Rs 48.4 lakh formed the disclosed component of other income. As EBITDA excludes other income, the Rs 1.75 crore EBITDA measure separates the presentation’s operating-profit measure from this income line.
Depreciation and amortisation expense increased to Rs 19.5 lakh in H1 FY27 from Rs 1.3 lakh in H1 FY26 and Rs 15.1 lakh in H2 FY26. Despite that increase, profit before tax rose from Rs 1.63 crore in H1 FY26 to Rs 2.26 crore, supported by the increase in other income. Finance costs were reported as nil in H1 FY27, versus Rs 0.1 lakh in H1 FY26.
The presentation does not forecast future treasury gains or other income. It also labels year-on-year and half-on-half comparisons for other income as not meaningful, reflecting the movement from Rs 5.7 lakh in H1 FY26 and Rs 18.5 lakh in H2 FY26 to Rs 70.5 lakh in H1 FY27. The recurrence of this contribution is therefore not resolved in the disclosed half-year information.
Got a follow-up? Ask IRIS
What do Sodhani Capital’s business indicators show?
Sodhani Capital reported assets under management, or AUM, of Rs 566 crore on 30 September 2026, up 18.0% from Rs 479.9 crore on 31 March 2026. AUM was Rs 453 crore in FY25, Rs 390 crore in FY24 and Rs 263 crore in FY23. The company stated that AUM recorded a 22.2% compound annual growth rate from FY23 to FY26.
The monthly systematic investment plan, or SIP, book reached Rs 6.46 crore on 30 September 2026, compared with Rs 6.12 crore at FY26-end, an increase of 5.6%. Active clients increased by four to 5,268 during the same period. Average AUM per client rose 17.9% to Rs 10.7 lakh, indicating that AUM growth outpaced the change in active-client numbers.
Mutual fund distribution accounted for about 95% of FY26 income and remains Sodhani Capital’s established business. During FY26, clients added Rs 123.75 crore of net fresh inflows despite an Rs 11.13 crore market impact. The presentation notes that AUM represents the market value of client investments and can move with market performance.
Which disclosed plans could affect Sodhani Capital’s next results?
Sodhani Capital has launched three new verticals, although the presentation gives no revenue or profit contribution for them. The PL Capital master franchise for Rajasthan, covering equity, portfolio management services, or PMS, and demat accounts, was launched in H1 FY27 and has generated initial revenue. The home-loan corporate direct selling agent, or DSA, business launched in September 2026, while the non-banking financial company, or NBFC, aggregator has also started.
Management describes equity, PMS and demat as an expanding vertical, home loans as high potential, and the NBFC aggregator as scalable. Its stated geographic plan runs from its Jaipur headquarters to a Mumbai office, where operations are set to commence, followed by a pan-India partner network. The presentation does not state a Mumbai commencement date or financial targets for the new businesses.
Sodhani Capital had deployed 87% of initial public offering proceeds as of 30 September 2026 and paid an FY26 dividend of Rs 0.50 per share. After the reporting period, Niveshak Darbaar 9.0 in Jaipur on 3 October 2026 drew more than 1,400 participants. That event followed H1 FY27 and was reported as a business update rather than part of the half-year financial results.
Conclusion
Sodhani Capital reported operating-revenue growth of 14.7% and EBITDA growth of 10.6% in H1 FY27, while PAT grew 27.8% to Rs 1.60 crore. The difference reflects Rs 70.5 lakh of other income, including Rs 48.4 lakh of treasury gains, while the EBITDA margin was 69.9%, below the 72.5% reported in H1 FY26.
The next disclosures should show whether revenue from operations and the 69.9% EBITDA margin progress as the new verticals develop. Management’s disclosed plans leave several matters to watch: deployment of the remaining 13% of initial public offering proceeds, the start of Mumbai operations, and the future level of other income, for which the presentation gives no forecast.