










SPAL revenue rose 84% as EBITDA margin fell to 13.8%
Key highlights
- SPAL’s consolidated revenue increased from Rs 859.43 crore in FY22 to Rs 1,578.64 crore in FY26.
- SPAL’s consolidated EBITDA margin declined from 18.6% in FY22 to 13.8% in FY26.
- SPAL’s garment division reported FY26 revenue of Rs 1,421.98 crore and a 16.2% EBITDA margin.
- SPAL reported FY26 net debt of Rs 217.05 crore and net debt to equity of 0.23.
powered by IRIS
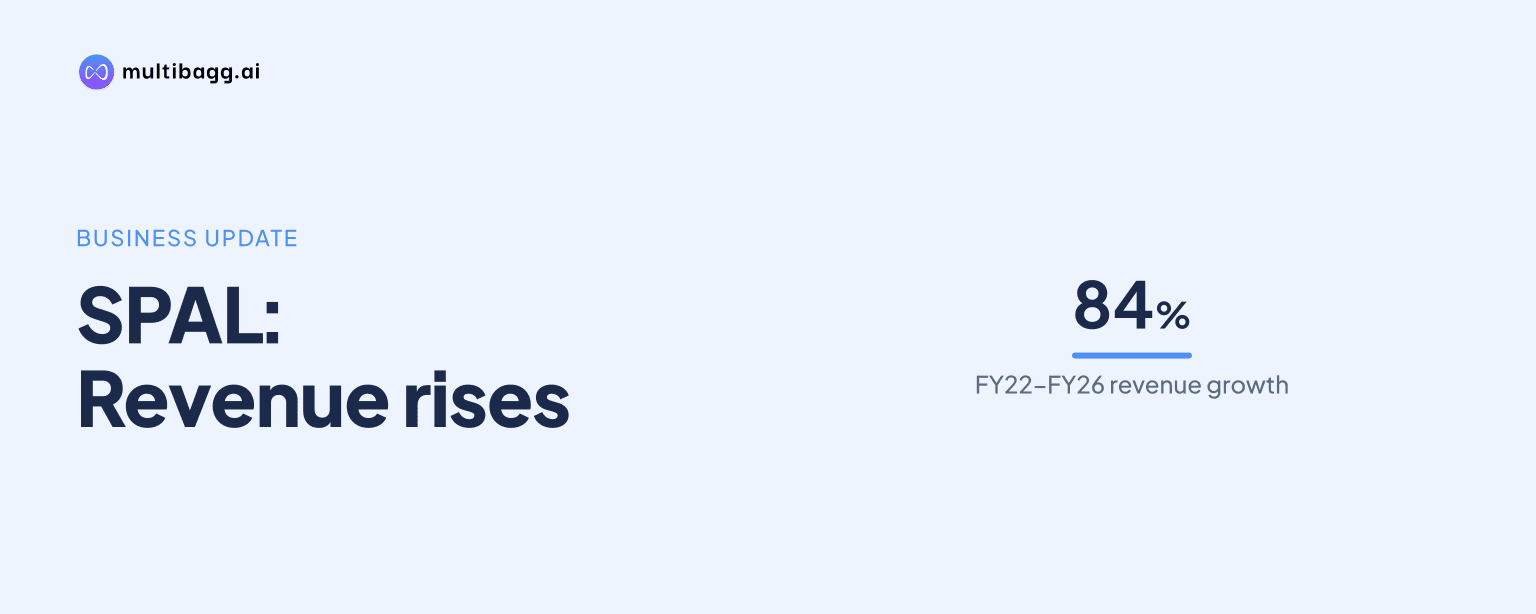
S.P. Apparels Limited reported consolidated revenue of Rs 1,578.64 crore in FY26, 84% above Rs 859.43 crore in FY22, while its consolidated EBITDA margin was 13.8%, down from 18.6%. FY26 EBITDA was Rs 217.81 crore and profit after tax margin was 6.4%, compared with 9.7% in FY22.
Know S P Apparels inside out
Results, valuation, peers and who's buying, in one view.
How much did SPAL revenue grow from FY22 to FY26?
SPAL’s consolidated revenue increased by Rs 719.21 crore between FY22 and FY26, reaching Rs 1,578.64 crore from Rs 859.43 crore. The growth was uneven: revenue rose to Rs 1,077.88 crore in FY23, was Rs 1,087.36 crore in FY24, then increased to Rs 1,395.13 crore in FY25 and Rs 1,578.64 crore in FY26.
SPAL’s EBITDA increased in rupee terms over the five years, but its margins remained below FY22 levels. Profit after tax, or PAT, increased from Rs 84.69 crore in FY22 to Rs 100.95 crore in FY26, while PAT margin declined by 3.3 percentage points to 6.4%.
Why was SPAL’s FY26 EBITDA margin below FY22?
SPAL’s consolidated EBITDA margin was 13.8% in FY26, 4.8 percentage points below the 18.6% reported in FY22, although EBITDA rose by Rs 56.58 crore over the period. The margin reached 13.5% in FY25 before improving by 0.3 percentage points in FY26.
SPAL’s PAT margin followed a similar direction, falling from 9.7% in FY22 to 6.4% in FY26 even as FY26 PAT reached Rs 100.95 crore. The presentation reports consolidated and segment outcomes but does not state a quantified reason for the margin movement, so it does not establish a specific cause.
Which SPAL divisions changed most between FY22 and FY26?
SPAL’s garment division reported revenue of Rs 1,421.98 crore in FY26, compared with Rs 742.93 crore in FY22. Garment EBITDA rose from Rs 155.32 crore to Rs 230.57 crore, but the division’s EBITDA margin declined from 20.9% to 16.2%.
The garment division’s 16.2% margin was unchanged between FY25 and FY26, while revenue increased by Rs 113.80 crore from Rs 1,308.18 crore. SPAL states that garment-division figures for FY25 and FY26 include Young Brand Apparel, which affects comparisons with FY22 through FY24.
SPAL’s retail revenue rose from Rs 48.02 crore in FY22 to Rs 80.56 crore in FY23, then declined to Rs 71.54 crore in FY26. Retail EBITDA remained negative, but the loss narrowed to Rs 6.1 lakh in FY26 from Rs 6.84 crore in FY25 and Rs 8.19 crore in FY24.
SPUK reported revenue of Rs 87.04 crore in FY26, compared with Rs 76.24 crore in FY22 and Rs 75.04 crore in FY25. Its EBITDA moved from Rs 2.65 crore in FY22 to a Rs 3.40 crore loss in FY25, before returning to positive EBITDA of Rs 1.10 crore in FY26.
Got a follow-up? Ask IRIS
How did SPAL debt and return measures change?
SPAL reported net debt of Rs 217.05 crore in FY26, compared with Rs 141.48 crore in FY22 and Rs 40.25 crore in FY23. The presentation defines net debt as total debt less cash and current investments, and reports a net-debt-to-equity ratio of 0.23 in FY26.
The FY26 net-debt-to-equity ratio of 0.23 was slightly below FY25’s 0.24, but above the 0.06 reported in FY23. Equity increased each year in the presentation, reaching Rs 946.13 crore in FY26 from Rs 637.77 crore in FY22.
Return on equity, or ROE, declined from 20.2% in FY22 to 15.7% in FY26. Cash-adjusted return on capital employed, or cash-adjusted ROCE, was 17.9% in FY26, compared with 16.9% in FY25 and 17.7% in FY22.
What export opportunities does SPAL identify?
SPAL identifies the India-UK free trade agreement as an opportunity because the presentation says it would remove an approximate 12% tariff disadvantage for Indian textile exports to the UK. India has about 6.1% of the UK textile market and is the fourth-largest supplier, according to the presentation.
SPAL also cites the continuation of the Rebate of State and Central Taxes and Levies on Export of Garments and Made-ups, or RoSCTL, scheme through March 2026. The presentation says the central government approved an Export Promotion Mission with an outlay of about Rs 25,060 crore through FY31.
Management presents these measures as potential support for entry into newer export geographies, employee training, demand and profitability. The presentation does not provide a revenue target, order value or timeline linking the measures to SPAL’s reported FY26 revenue of Rs 1,578.64 crore.
Conclusion
SPAL expanded consolidated revenue by Rs 719.21 crore and EBITDA by Rs 56.58 crore between FY22 and FY26, led by higher garment-division revenue. However, consolidated EBITDA margin fell 4.8 percentage points, PAT margin declined 3.3 percentage points, retail remained EBITDA-negative, and FY26 net debt stood at Rs 217.05 crore.
The next reported results will show whether garment margin moves above the 16.2% recorded in both FY25 and FY26, whether retail turns its Rs 6.1 lakh FY26 EBITDA loss into a profit, and whether SPUK sustains positive EBITDA after Rs 1.10 crore in FY26. Management also identifies export-support measures, including the Export Promotion Mission planned through FY31, as a potential area to monitor.